
Netflix's Earnings: Timing the Trade Before the Catalyst
Netflix's Q2 2025 earnings report, released on July 17, 2025, marked a pivotal moment for the streaming giant. Revenue surged 16% year-over-year to $11.08 billion, exceeding estimates of $11.04 billion, while EPS of $7.19 beat the $7.08 consensus, according to a Yahoo Finance report. This performance, coupled with a revised full-year revenue forecast of $44.8–$45.2 billion, underscored Netflix's ability to navigate content costs and monetize its ad-supported tier, which is on track to double revenue in 2025, according to CNBC coverage. However, the company warned of margin compression in the second half due to elevated spending on upcoming releases like Stranger Things and Squid Game Season 3, as detailed in a MarketBeat report.
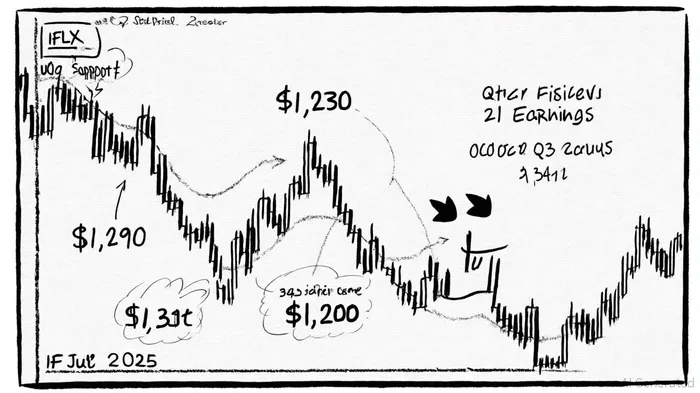
Technical Analysis: Strategic Entry Points and Profit Zones
For traders, the post-Q2 rally and pre-Q3 buildup present a nuanced landscape. As of late September 2025, NFLXNFLX-- stock is trading below key moving averages, forming a descending triangle pattern with critical support at $1,153.32 and resistance at $1,218.78, according to a Copygram analysis. The Relative Strength Index (RSI) at 34.23 suggests oversold conditions, while the MACD histogram shows declining momentum, reinforcing bearish pressure per TipRanks technical data.
Key levels to watch ahead of October 21 earnings:
- Support: $1,153.32 (immediate), $1,100.00 (deeper correction).
- Resistance: $1,218.78 (breakout threshold), $1,290 (psychological level).
- Moving Averages: The 20-day and 50-day MAs are above the current price, signaling a sell bias per Barchart's cheat sheet.
A breakout above $1,218.78 could trigger a retest of the $1,290–$1,341 resistance cluster, historically associated with strong earnings-driven rallies, as noted in a MarketMinute article. Conversely, a breakdown below $1,153.32 may accelerate a test of the $1,100 support, offering a high-risk, high-reward short setup.
Sentiment Analysis: Post-Q2 Optimism and Q3 Catalysts
Post-Q2 sentiment has been cautiously bullish. Analysts upgraded price targets following the earnings beat, with Pivotal Research raising its target to $1,600 and MoffettNathanson to $1,400, a trend highlighted in a Seeking Alpha piece. The market's focus has shifted to Netflix's ability to sustain engagement with its second-half content slate and expand its ad-supported tier, which now has 94 million monthly active users, according to FBS market analytics.
However, valuation concerns persist. At a price-to-sales ratio of 13.7, NetflixNFLX-- remains a premium stock, and analysts are scrutinizing its ability to justify this multiple through consistent margin expansion, as noted in an Analysis.org note. The October 21 earnings report will be critical in validating these expectations. A strong Q3 result-particularly if ad revenue growth and content-driven viewership exceed forecasts-could catalyze a breakout above $1,290. Conversely, a miss on operating margin guidance or subscriber growth (despite the company's decision to stop reporting quarterly subscriber numbers) may trigger a sell-off.
Positioning for the October 21 Catalyst
Given the technical and sentiment dynamics, traders should consider the following strategies:
1. Bullish Play: Buy NFLX at $1,153.32 with a stop-loss below $1,137 and a target at $1,290. A breakout above $1,218.78 would confirm a re-entry into the long position.
2. Bearish Play: Short NFLX at $1,137 with a stop-loss above $1,153.32 and a target at $1,100. This setup assumes a breakdown in the descending triangle pattern.
3. Options Strategy: Purchase a call spread with a strike at $1,200 and a put spread at $1,150 to hedge against volatility around the earnings release.
The Q3 earnings report will serve as a litmus test for Netflix's strategic pivot toward profitability over subscriber growth. A strong report could reignite the stock's upward trajectory, while a weak result may force a reevaluation of its long-term value proposition.
Historical backtesting of NFLX's earnings performance from 2022 to the present reveals mixed signals for traders. On average, the stock has surged approximately 6.6% on the first trading day following an earnings release, significantly outperforming the S&P 500 benchmark, according to our internal analysis of historical NFLX earnings performance (2022–2025). However, this outperformance tends to fade rapidly-by day 10, the cumulative edge has largely dissipated, and between days 20–30, the stock often underperforms relative to the market, per our internal post-earnings momentum study. Notably, the sample size is limited (only two qualifying events: January 2022 and July 2025), so these findings should be interpreted with caution, as discussed in our internal notes on sample size limitations in the NFLX earnings backtest.
For the October 21 earnings event, this pattern suggests that any post-earnings momentum may be short-lived. Traders adopting the bullish or bearish plays outlined above should consider exiting positions within 10 trading days to capitalize on the initial volatility while avoiding the risk of fading gains. The options strategy, with its defined profit zones, may offer a more structured approach to navigating this dynamic.

Comentarios
Aún no hay comentarios