
Navitas Outlook - A Volatile Week with Mixed Signals
Generado por agente de IAAinvest Stock DigestRevisado porShunan Liu
martes, 11 de noviembre de 2025, 7:58 pm ET2 min de lectura
NVTS--
```htmlMarket SnapshotHeadline takeaway: NavitasNVTS-- (NVTS.O) is showing a weak technical profile with mixed fundamentals and a bearish-leaning analyst landscape, suggesting investors should proceed cautiously. The stock has fallen by 25.18% in recent days, which contrasts with a relatively neutral market expectation.
News HighlightsRecent news continues to highlight geopolitical and environmental pressures on the semiconductor industry, with Navitas indirectly in the spotlight: May 30, 2025 - McKinsey on Tariffs and Chip Supply Chains: New research from McKinsey outlines the potential impact of U.S. tariffs on semiconductors. This could affect Navitas, as it operates within a globally sensitive sector. May 28, 2025 - Semiconductors ETF SOXX Sees $750M Outflow: The $750M net outflow from the US Semiconductors ETF signals growing risk aversion in the sector, which could indirectly pressure Navitas and similar names.
Analyst Views & FundamentalsAnalyst sentiment is mixed but leaning neutral. In the last 20 days, two institutions—Needham and Rosenblatt—have issued ratings. Here’s a summary of the key metrics: 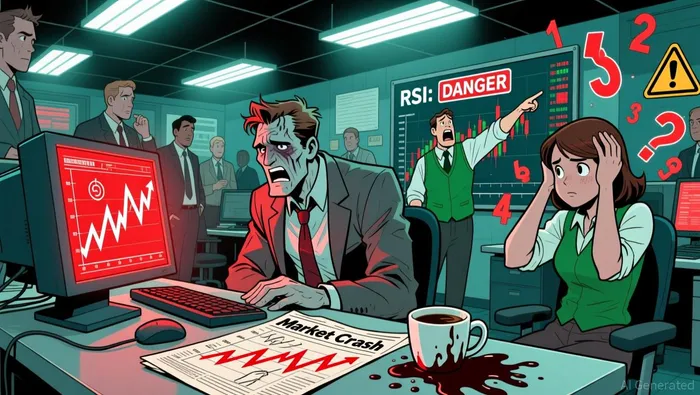 Average rating score (simple mean): 3.67 Weighted rating score (performance-weighted): 3.20 Rating consistency: There are differences, with no strong consensus among analysts.
This mixed sentiment clashes with the current 25.18% price drop, which suggests investors are more bearish than the ratings imply. However, it's worth noting that the weighted average rating is slightly lower than the simple average, indicating that underperforming analysts carry more historical weight.
Money-Flow TrendsNavitas has seen mixed capital inflow patterns over the last week: Overall inflow ratio: 48.70% (suggesting slightly more inflow than outflow) Big-money (block) inflow ratio: 48.60%, which is also slightly positiveHowever, the overall trend remains negative, with all major investor categories (Small, Medium, Large, and Extra-large) showing a negative trend. This indicates that while retail and mid-sized investors may be cautiously entering, institutional money remains on the sidelines or is withdrawing. The stock has a fund-flow score of 7.85 (internal diagnostic score, 0-10), which is good for a stock in a weak price environment.
Key Technical SignalsNavitas has had a volatile week with several mixed chart patterns. The technical score is 4.74 (internal diagnostic score, 0-10), indicating a weak technical profile. Bearish Engulfing: Score of 8.33 (internal diagnostic score, 0-10). This is a strong bullish signal in the candlestick pattern, but it’s isolated in a bearish context. Inverted Hammer: Score of 1.00 (internal diagnostic score, 0-10), suggesting it’s a very weak bearish signal. Its historical average return is -20.45%, and it has a 0.00% win rate. RSI Oversold: Score of 3.49 (internal diagnostic score, 0-10), indicating limited potential for a rebound, with a 50.00% win rate.
In the last five days, notable patterns include Inverted Hammer and WR Oversold on 2025-11-04, and a Bearish Engulfing on 2025-11-05. These patterns suggest high volatility and unclear direction.
ConclusionNavitas is in a high-volatility phase with more bearish signals than bullish ones. While the fund-flow score is good (7.85), and a few candlestick patterns suggest potential short-term rebounds, the overall technical and fundamental outlook remains weak. With 4 bearish indicators vs. 1 bullish, and mixed analyst ratings, the stock may be best approached with caution. Actionable takeaway: Investors may want to wait for a clearer breakout before making a move. Keep an eye on upcoming earnings or news related to the U.S. tariff environment, which could provide further clarity on the sector’s trajectory.
```
Average rating score (simple mean): 3.67 Weighted rating score (performance-weighted): 3.20 Rating consistency: There are differences, with no strong consensus among analysts.
This mixed sentiment clashes with the current 25.18% price drop, which suggests investors are more bearish than the ratings imply. However, it's worth noting that the weighted average rating is slightly lower than the simple average, indicating that underperforming analysts carry more historical weight.
Money-Flow TrendsNavitas has seen mixed capital inflow patterns over the last week: Overall inflow ratio: 48.70% (suggesting slightly more inflow than outflow) Big-money (block) inflow ratio: 48.60%, which is also slightly positiveHowever, the overall trend remains negative, with all major investor categories (Small, Medium, Large, and Extra-large) showing a negative trend. This indicates that while retail and mid-sized investors may be cautiously entering, institutional money remains on the sidelines or is withdrawing. The stock has a fund-flow score of 7.85 (internal diagnostic score, 0-10), which is good for a stock in a weak price environment.
Key Technical SignalsNavitas has had a volatile week with several mixed chart patterns. The technical score is 4.74 (internal diagnostic score, 0-10), indicating a weak technical profile. Bearish Engulfing: Score of 8.33 (internal diagnostic score, 0-10). This is a strong bullish signal in the candlestick pattern, but it’s isolated in a bearish context. Inverted Hammer: Score of 1.00 (internal diagnostic score, 0-10), suggesting it’s a very weak bearish signal. Its historical average return is -20.45%, and it has a 0.00% win rate. RSI Oversold: Score of 3.49 (internal diagnostic score, 0-10), indicating limited potential for a rebound, with a 50.00% win rate.
In the last five days, notable patterns include Inverted Hammer and WR Oversold on 2025-11-04, and a Bearish Engulfing on 2025-11-05. These patterns suggest high volatility and unclear direction.
ConclusionNavitas is in a high-volatility phase with more bearish signals than bullish ones. While the fund-flow score is good (7.85), and a few candlestick patterns suggest potential short-term rebounds, the overall technical and fundamental outlook remains weak. With 4 bearish indicators vs. 1 bullish, and mixed analyst ratings, the stock may be best approached with caution. Actionable takeaway: Investors may want to wait for a clearer breakout before making a move. Keep an eye on upcoming earnings or news related to the U.S. tariff environment, which could provide further clarity on the sector’s trajectory.
```Divulgación editorial y transparencia de la IA: Ainvest News utiliza tecnología avanzada de Modelos de Lenguaje Largo (LLM) para sintetizar y analizar datos de mercado en tiempo real. Para garantizar los más altos estándares de integridad, cada artículo se somete a un riguroso proceso de verificación con participación humana.
Mientras la IA asiste en el procesamiento de datos y la redacción inicial, un miembro editorial profesional de Ainvest revisa, verifica y aprueba de forma independiente todo el contenido para garantizar su precisión y cumplimiento con los estándares editoriales de Ainvest Fintech Inc. Esta supervisión humana está diseñada para mitigar las alucinaciones de la IA y garantizar el contexto financiero.
Advertencia sobre inversiones: Este contenido se proporciona únicamente con fines informativos y no constituye asesoramiento profesional de inversión, legal o financiero. Los mercados conllevan riesgos inherentes. Se recomienda a los usuarios que realicen una investigación independiente o consulten a un asesor financiero certificado antes de tomar cualquier decisión. Ainvest Fintech Inc. se exime de toda responsabilidad por las acciones tomadas con base en esta información. ¿Encontró un error? Reportar un problema

SOBRE NOSOTROS
Nuestra historiaAutores de noticiasBase de conocimientosPolítica de privacidadTérmino de usoDescargo de responsabilidad de corretaje de tercerosTérminos de uso de AIMEDivulgaciones de riesgos de AInvest AICarrerasCONTÁCTENOS
Email: support@ainvest.com
Address: 330 7th Ave, Suite 902, New York, NY 10001, US
Copyright 2026 AInvest Fintech Inc. All rights reserved.
Comentarios
Aún no hay comentarios