
Navigating Elliott Wave Volatility in $INJ: Tactical Risk Management for 2025
Injective Protocol ($INJ) has emerged as a focal point of volatility in 2025, driven by conflicting signals from classical Elliott Wave patterns and sentiment-driven pullbacks. For tactical investors, understanding these dynamics is critical to balancing risk and reward in a market that oscillates between bullish optimism and bearish caution.
Elliott Wave Patterns: A Tale of Two Trends
Elliott Wave analysis reveals a complex narrative for $INJ. In early 2025, the token followed a textbook five-wave impulse pattern, surging to an all-time high of $53 in March 2024 before correcting to $13.70 by August 2024, according to a CCN analysis. This correction phase, labeled as a "Wave 2" retracement, set the stage for a potential Wave 3 rally. However, by October 2025, the price had consolidated near $12.07, with analysts debating whether this signaled a deeper bearish correction or a temporary consolidation ahead of a breakout, according to a CoinCodex forecast.
Key resistance levels at $28.76 and $33.44 remain pivotal. A sustained close above $28.76 could validate a bullish Wave 3 scenario, projecting targets of $33.44 and even $38.11 based on Fibonacci extensions noted in the CCN analysis. Conversely, failure to hold above $20.13-a critical support level-risks invalidating the bullish case and triggering a descent toward $16.21 or $18.17, a scenario the CCN analysis also highlights.
Sentiment-Driven Pullbacks: Greed, Fear, and the RSI
Sentiment indicators paint a mixed picture. The Fear & Greed Index, which measures market psychology, hit 70 ("Greed") in October 2025, suggesting overbought conditions and a heightened risk of a pullback, as reported by CoinCodex. Meanwhile, the RSI has flattened near 47.39, indicating neutral momentum but lacking a clear directional bias, a reading also noted by CoinCodex. This ambiguity is compounded by the MACD histogram, which shows bearish divergence as price action peaks without corresponding momentum, as described in a Blockchain.News forecast.
September 2025 data further complicates the outlook. The price has been range-bound between $12.25 and $16.55, with a breakout above $14.09 (the 20-period SMA) potentially reigniting bullish momentum-the Blockchain.News piece also flagged this level. However, volume and ADX readings remain muted, signaling a lack of conviction in either direction, according to a Blockonomi report.
Tactical Risk Management: Positioning for Volatility
Given these conflicting signals, tactical investors must prioritize risk management over speculative bets. Here's how:
- Define Clear Entry/Exit Points:
- Bullish Case: Use $20.13 as a dynamic support level. A retest of this level with increasing volume could signal a low-risk entry for Wave 3.
Bearish Case: Place stop-loss orders below $16.21 to mitigate losses if the correction deepens.
Leverage Fibonacci Retracements:
Monitor 61.8% and 78.6% retracement levels of the Wave 1-2 move (from $23.48 to $20.30) as potential reversal zones identified by the CCN analysis.
Time Entries with Sentiment Divergence:
A drop in the Fear & Greed Index below 50 ("Fear") could coincide with a short-term rebound. Conversely, an RSI dip below 30 might signal oversold conditions for a countertrend trade, a tactic referenced in the Blockchain.News forecast.
Position Sizing Based on Volatility:
- Given INJ's 2025 volatility (±40% range), allocate no more than 5-10% of a portfolio to the token, with trailing stops adjusting to 5% below key support levels.
The Path Forward: Balancing Optimism and Caution
Injective's technological upgrades-such as the INJ 3.0 protocol and AUSD stablecoin-remain bullish catalysts, but their impact is contingent on broader market adoption, a point underscored by the CCN analysis. For now, the price is trapped in a "range-bound limbo," where sentiment-driven pullbacks could either accelerate a breakout or deepen the correction.
Investors should treat INJ as a high-beta asset, using technical triggers (e.g., a close above $13.70) to validate directional bias, a stance echoed in the Blockonomi report. A breakout above $28.76 would signal a return to the Wave 3 narrative, while a breakdown below $12.67 could extend the bearish phase into 2026. 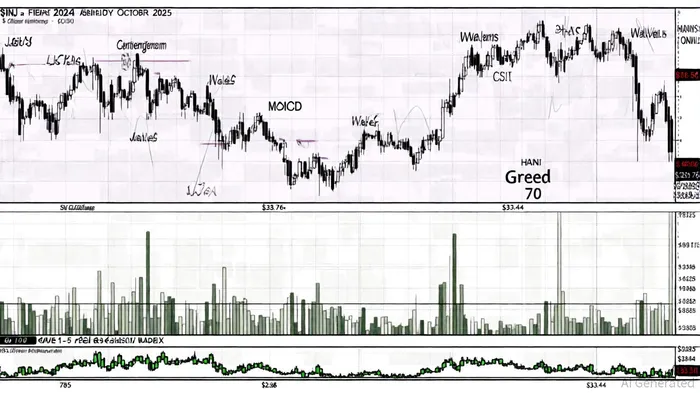


Comentarios
Aún no hay comentarios