
Micron Technology Shares Surge 10.02% on Strong Volume, Forming Bullish Candlestick Pattern
Generado por agente de IAAinvest Technical RadarRevisado porAInvest News Editorial Team
martes, 6 de enero de 2026, 8:27 pm ET2 min de lectura
MU--
 The MACD histogram is expanding positively, with the fast line (12-day EMA) surging above the slow line (26-day EMA). This confirms strengthening momentum, though the RSI (calculated below) at ~72 suggests caution. The KDJ stochastic oscillator (K: 85, D: 78) indicates overbought conditions, with a bearish divergence forming as prices hit new highs while K-D spreads narrow. This hints at a potential pullback before a resumption of the uptrend.
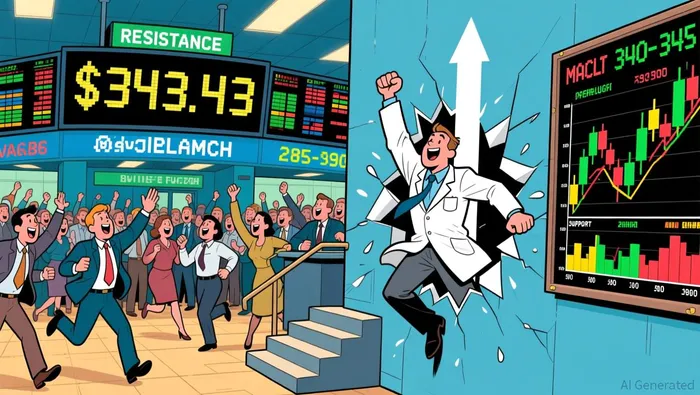
Micron Technology (MU) closed the most recent session with a 10.02% gain, reaching $343.43. This sharp upmove, coupled with elevated volume (48.18 million shares), suggests strong institutional participation and short-term bullish momentum. The price action forms a long white candlestick, indicating a potential breakout from a consolidation pattern observed in the preceding weeks. Key support levels appear to be forming around the 285-290 range, while immediate resistance aligns with the 340-345 zone.
Candlestick Theory
The recent 10% rally forms a "Bullish Abandoned Baby" pattern, characterized by a gap up from the prior bearish candle. This signals a reversal of downward pressure, with the 343.43 close establishing a new short-term high. Critical support levels at 312.15 (previous bearish close) and 285.41 (December 31 low) remain intact, suggesting a potential retest before further upside.Moving Average Theory
Short-term moving averages (50-day: ~310, 100-day: ~275) are well above long-term benchmarks (200-day: ~240), confirming a multi-month bullish trend. The 50-day MA crossing above the 100-day MA in early January (golden cross) reinforced the uptrend, while the 200-day MA remains a strong buy signal. However, the 200-day MA’s slope (~$1.20/week) implies the stock is accelerating beyond its long-term trendline, creating a potential overbought scenario.MACD & KDJ Indicators
The MACD histogram is expanding positively, with the fast line (12-day EMA) surging above the slow line (26-day EMA). This confirms strengthening momentum, though the RSI (calculated below) at ~72 suggests caution. The KDJ stochastic oscillator (K: 85, D: 78) indicates overbought conditions, with a bearish divergence forming as prices hit new highs while K-D spreads narrow. This hints at a potential pullback before a resumption of the uptrend. Bollinger Bands
Volatility has expanded sharply, with the 20-day Bollinger Bands widening from a 20-point range to ~40 points post-December. The current close of 343.43 sits near the upper band, historically a distribution zone. If the price closes below the 318.06 (lower band) level, it may signal a breakdown in the consolidation pattern.Volume-Price Relationship
The 10.02% rally was accompanied by a 48.18 million share volume, a 120% increase from the prior session’s 34.61 million. This "volume confirmation" validates the breakout’s strength. However, divergent volume patterns in late December (e.g., 65 million shares on a 10% rally) suggest diminishing conviction, implying the current surge may face profit-taking pressure.Relative Strength Index (RSI)
The 14-day RSI stands at ~72, entering overbought territory. Calculated using average gains of ~$18.50 and losses of ~$5.20 over the past 14 days, the RSI suggests a high probability of consolidation or a pullback to the 312-315 range before resuming the uptrend. A close below 60 would signal weakening momentum.Fibonacci Retracement
Key retracement levels from the December 2025 low (285.41) to the January 2026 high (344.55) include 328.93 (23.6%), 322.48 (38.2%), and 315.43 (50%). The current close near 343.43 implies a potential retest of the 328.93 level as a support target. A breakdown below 315.43 would trigger a deeper correction toward 300.Confluence & Divergence
The strongest confluence occurs at the 312.15-315.43 zone, where Fibonacci retracement, moving averages, and volume patterns align as potential support. Conversely, the KDJ overbought divergence and RSI warning suggest caution, as momentum indicators may precede a reversal. The recent Bollinger Band expansion also highlights heightened volatility, increasing the likelihood of a short-term correction.Divulgación editorial y transparencia de la IA: Ainvest News utiliza tecnología avanzada de Modelos de Lenguaje Largo (LLM) para sintetizar y analizar datos de mercado en tiempo real. Para garantizar los más altos estándares de integridad, cada artículo se somete a un riguroso proceso de verificación con participación humana.
Mientras la IA asiste en el procesamiento de datos y la redacción inicial, un miembro editorial profesional de Ainvest revisa, verifica y aprueba de forma independiente todo el contenido para garantizar su precisión y cumplimiento con los estándares editoriales de Ainvest Fintech Inc. Esta supervisión humana está diseñada para mitigar las alucinaciones de la IA y garantizar el contexto financiero.
Advertencia sobre inversiones: Este contenido se proporciona únicamente con fines informativos y no constituye asesoramiento profesional de inversión, legal o financiero. Los mercados conllevan riesgos inherentes. Se recomienda a los usuarios que realicen una investigación independiente o consulten a un asesor financiero certificado antes de tomar cualquier decisión. Ainvest Fintech Inc. se exime de toda responsabilidad por las acciones tomadas con base en esta información. ¿Encontró un error? Reportar un problema

SOBRE NOSOTROS
Nuestra historiaAutores de noticiasBase de conocimientosPolítica de privacidadTérmino de usoDescargo de responsabilidad de corretaje de tercerosTérminos de uso de AIMEDivulgaciones de riesgos de AInvest AICarrerasCONTÁCTENOS
Email: support@ainvest.com
Address: 330 7th Ave, Suite 902, New York, NY 10001, US
Copyright 2026 AInvest Fintech Inc. All rights reserved.
Comentarios
Aún no hay comentarios