
Market Overview for USDC/Czech Koruna (USDCCZK)
Summary
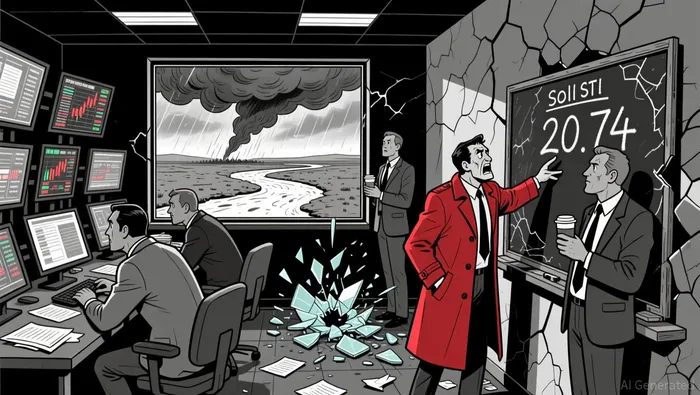
• USDCCZK traded in a narrow range before breaking to the downside with a bearish engulfing pattern at 20.74.
• RSI signaled oversold conditions near 29, suggesting limited bearish momentum.
• Volatility increased in late trading with a drop in turnover, raising questions about conviction.
• Bollinger Bands expanded during the breakdown, showing increased uncertainty.
• Volume surged during the initial breakdown and then declined, hinting at waning selling pressure.
USDCCZK opened at 20.84 on 2025-12-10 at 12:00 ET and traded as high as 20.84 and as low as 20.65 before closing at 20.69 on 2025-12-11 at 12:00 ET. The 24-hour volume totaled 51,725.0 and notional turnover amounted to approximately 1,068,489.35 CZK.
Structure & Formations
A bearish engulfing pattern formed around 20.74 as the pair moved lower after a prolonged consolidation phase. Key support levels appear to be forming near 20.74 and 20.68, with resistance retesting 20.76–20.77. A doji emerged near 20.73, suggesting indecision and potential reversal signals.
Moving Averages
The 5-minute 20 and 50-period moving averages crossed bearishly into the lower end of the range. Daily moving averages (50/100/200) remained stable but slightly bearish, aligning with the breakdown from consolidation.
MACD & RSI
The MACD crossed into negative territory during the breakdown and remained bearish into the close. RSI dropped into the 29–30 range, indicating oversold conditions, though without a clear reversal in price.
Bollinger Bands
Volatility expanded during the breakdown as the price moved below the lower band. The bands remained relatively wide for much of the 24-hour window, reflecting uncertainty and increased trading pressure during the move toward 20.65.
Volume & Turnover
Volume spiked during the initial bearish breakdown near 20.74, with a peak of 3,281.0 units, but then declined significantly as the price moved lower. Notional turnover also peaked and then waned, suggesting weaker conviction in the bearish move as it progressed.
**
Fibonacci Retracements
Key Fibonacci retracement levels during the 5-minute chart breakdown pointed to potential support near 20.72 (38.2%) and 20.68 (61.8%). The pair briefly found support at the 61.8% level, suggesting a potential short-term floor.
The market may test the 20.74 support again in the coming 24 hours with a risk of a break and hold into 20.65. Investors should remain cautious for a potential rebound from 20.68, though downside risk remains elevated in the near term.


Comentarios
Aún no hay comentarios