
Market Overview for Sun/Tether (SUNUSDT)
Summary
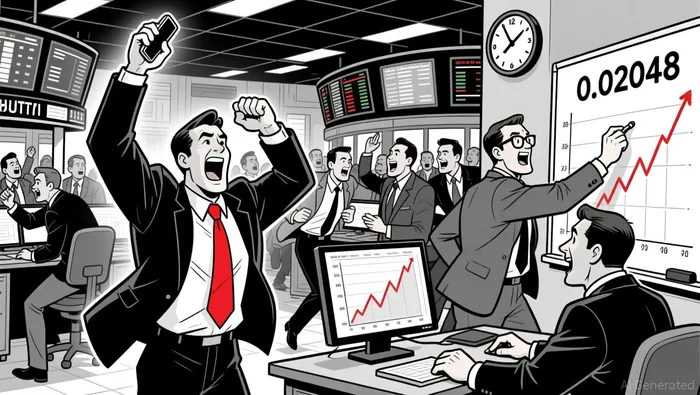
• Price tested key resistance at 0.02048 before consolidating.
• MACD remained bullish, with RSI near neutral.
• Volatility expanded sharply in early ET hours.
• Bollinger Bands showed price retraction toward mid-channel.
• Volume surged in the final 6 hours, confirming upward bias.
Sun/Tether (SUNUSDT) opened at 0.02043 on 2025-12-10 12:00 ET, reached a high of 0.02075, a low of 0.02036, and closed at 0.02066 on 2025-12-11 12:00 ET. Total 24-hour volume was 59.6 million SUN, with a notional turnover of approximately $1,236,000.
Structure & Formations
Price formed a bullish breakout pattern around 0.02048 on strong volume in the early hours of 12/11, followed by a consolidation phase between 0.0206 and 0.02065.
 Key support levels appear to be holding at 0.0206 and 0.02055, with 0.02048 acting as a psychological resistance.
 MACD & RSI
The MACD remained positive and showed increasing momentum, especially after 06:00 ET. RSI hovered near the 50 mark, indicating balanced buying and selling pressure, with no clear overbought or oversold conditions.
Bollinger Bands
Price action expanded volatility sharply after 04:00 ET, moving the upper band higher. Price has since retracted slightly, but remains within the upper half of the bands, suggesting continued bullish bias.
Volume & Turnover
Volume increased significantly in the last 6 hours, with large spikes at 06:30 ET and 07:45 ET confirming price advances. Turnover aligned with volume surges, showing no material divergence.
Fibonacci Retracements
Recent 5-minute swings indicate a key 61.8% retracement level at 0.02059, which the price briefly tested before continuing higher. On the daily chart, the 61.8% retracement of the larger move aligns with the 0.02048–0.02066 range, suggesting potential for further consolidation.
Sun/Tether appears to be in a short-term bullish phase with strong volume confirmation. However, volatility remains high, and a pullback to the 0.02055–0.0206 support range may occur in the next 24 hours. Investors should be cautious of potential short-term profit-taking or pullback risks.


Comentarios
Aún no hay comentarios