
Market Overview for Pendle/Bitcoin on 2025-12-30
Summary
• Price declined from $2.154e-05 to $2.111e-05, forming bearish patterns and testing support.
• RSI signaled weakening momentum with oversold conditions near the 24-hour low.
• Volume surged during key declines, confirming bearish bias in PENDLEBTC.
• Bollinger Bands showed price hovering near lower bounds, indicating low volatility.
• MACD histogram contracted, suggesting fading bullish momentum.
The 24-hour session for Pendle/Bitcoin (PENDLEBTC) began at $2.154e-05 and closed at $2.111e-05 after reaching a high of $2.154e-05 and a low of $2.104e-05. Total volume traded was 14,533.1 units, with a notional turnover of $3.083.
Structure & Formations
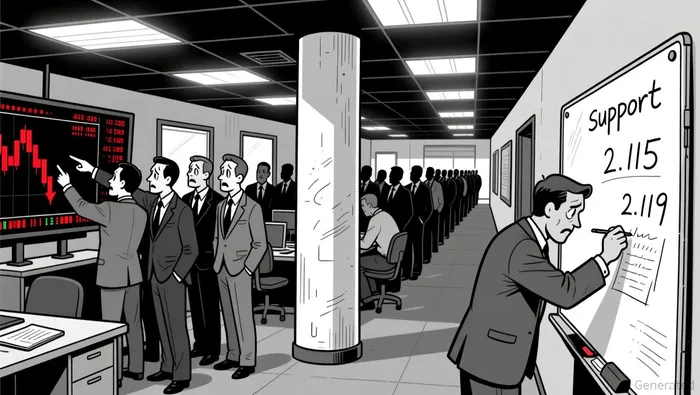
The price action showed multiple bearish signals including a strong bearish engulfing pattern and a long lower shadow during the key 201500-203000 ET period. The price repeatedly tested and failed to hold above $2.125e-05, forming a clear support level near $2.115e-05 to $2.119e-05.
Moving Averages
Short-term moving averages on the 5-minute chart dipped below the price, reinforcing the downward trend. Daily MA lines suggest a continuation of bearish momentum, with the price remaining below the 50- and 100-period averages.
MACD & RSI
The MACD line crossed below the signal line early in the session and remained negative, indicating bearish momentum. RSI dropped to oversold territory near 30, suggesting a potential short-term pause in the decline, though not necessarily a reversal.
Bollinger Bands
Price action remained in the lower half of the Bollinger Bands throughout the session, with volatility contracting in the final hours. The narrowing bands may suggest a potential breakout or continuation of the trend.
Volume & Turnover
Volume spiked during the key 034500–043000 ET period as price dropped from $2.125e-05 to $2.119e-05, and again during the 154500–164500 ET range, confirming bearish continuation. Turnover aligned with price declines, showing no divergence.
Fibonacci Retracements
Recent 5-minute swings show the price finding support near the 38.2% and 61.8% Fibonacci levels, suggesting further downward movement could target the 78.6% level at approximately $2.104e-05.
In the near term, a bounce off $2.115e-05 could test the 50-period moving average as potential resistance, but a breakdown below that level may signal a deeper correction. Investors should remain cautious of increased bearish momentum and potential for further downside in the next 24 hours.


Comentarios
Aún no hay comentarios