
Market Overview for PancakeSwap/Tether (CAKEUSDT)
Summary
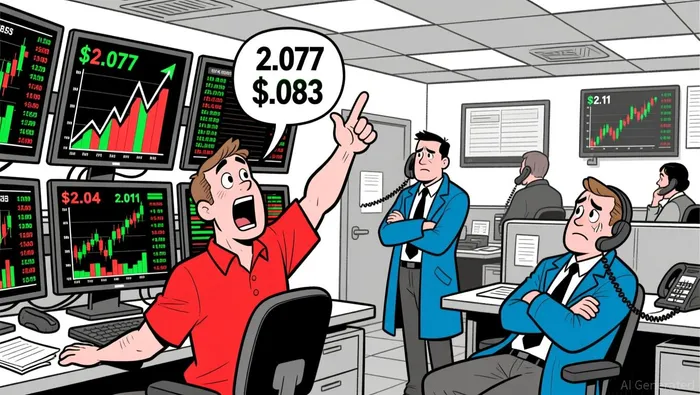
• Price tested $2.04–$2.083 range, with key resistance at $2.083 and support at $2.04.
• Volatility expanded after $2.11 high, but selling pressure emerged below $2.08.
• Momentum weakened as RSI entered overbought territory but failed to sustain above 61.8% Fib.
• Bollinger Bands showed contraction early, followed by sharp expansion as the price surged.
• Turnover surged past $1.6M during late-session breakout but failed to confirm bullish continuation.
PancakeSwap/Tether (CAKEUSDT) opened at $2.061 on 2026-01-05 12:00 ET, reached a high of $2.11, a low of $2.029, and closed at $2.042 by 12:00 ET. Total volume amounted to 1,688,885.98, with notional turnover of $3,463,532.10 over the 24-hour window.
Structure & Formations
The price formed a bullish flag pattern between $2.077 and $2.083, but a bearish engulfing pattern emerged after reaching $2.11. The pair then consolidated below key support at $2.04, suggesting further downward pressure may be expected if the level fails.
Moving Averages
Short-term moving averages (20/50) on the 5-minute chart trended upward during the breakout phase, but diverged from the price as the asset pulled back. Longer-term averages (50/100/200) on the daily chart remain in a bullish alignment, suggesting structural support remains intact.
MACD & RSI
The MACD showed a late-session bearish crossover as momentum waned after the $2.11 high. RSI peaked near overbought levels, but failed to confirm strength above the 61.8% Fibonacci retracement from the $2.029–$2.11 range, signaling potential exhaustion in the current rally.
Bollinger Bands
Bollinger Bands contracted early in the session, indicating low volatility, followed by a sharp expansion during the breakout. The price remained near the upper band during the rally, but closed near the middle band, suggesting reduced volatility ahead of a potential directional shift.
Volume & Turnover
Volume and turnover surged during the $2.11 high and the $2.035 low, with a large divergence in notional turnover (over $500K) during the pullback phase. This suggests mixed positioning and potential uncertainty among traders.
Looking ahead, a break below $2.029 may trigger a deeper test of prior support, while a retest of $2.083 could reignite short-term bullish momentum. Investors should remain cautious of diverging volume patterns and potential mean reversion if the current consolidation fails to break higher.


Comentarios
Aún no hay comentarios