
Market Overview for PancakeSwap/Tether (CAKEUSDT)
Summary
• CAKEUSDT formed bearish engulfing patterns and tested key support levels near 2.25 and 2.20.
• Momentum weakened as RSI dipped below 30, signaling potential oversold conditions.
• Volatility expanded late in the session with a sharp selloff below 2.215.
• Bollinger Bands showed price action tightening before the drop, hinting at a breakout.
• High turnover surges coincided with sharp price declines, indicating strong bear pressure.
PancakeSwap/Tether (CAKEUSDT) opened at 2.28 on 2025-12-06 12:00 ET and closed at 2.213 by 12:00 ET on 2025-12-07, hitting a high of 2.28 and a low of 2.201. The 24-hour trading volume totaled 962,988.19 and notional turnover reached $2,145,374.80.
Structure & Candlestick Patterns
Price action displayed bearish engulfing patterns during the early ET hours and a large bearish candle at 14:30 ET, signaling distribution.
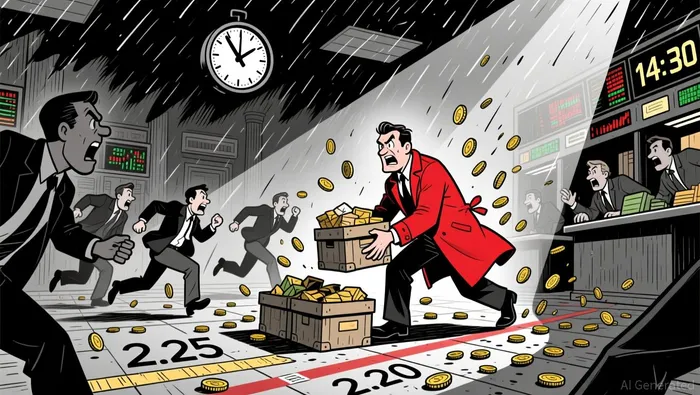 Key support levels at 2.25 and 2.20 were tested with a final breakdown below 2.215. The formation of small-bodied candles near 2.201 suggests a potential short-term oversold zone.
 Moving Averages and Momentum
The 20-period and 50-period moving averages on the 5-minute chart trended lower, confirming the bearish momentum. RSI fell below 30, highlighting potential oversold conditions. However, without a clear reversal signal, the pair may remain range-bound or continue its downward bias.
Volatility and Bollinger Bands
Bollinger Bands showed a tightening range in the morning before the sharp selloff. Price broke below the lower band at 14:30 ET, indicating a volatile bearish breakout. This may suggest a temporary exhaustion of the downtrend or a setup for a bounce.
Volume and Turnover
Volume and turnover spiked significantly during the 14:30–16:00 ET selloff, reinforcing the bearish move. The divergence between price and volume at the 13:30 ET session low also suggests a possible short-term bottoming process.
Looking ahead, CAKEUSDT may find temporary support near 2.20–2.215, where a bounce could occur. However, a break below this range could trigger further downside to 2.18. Investors should remain cautious and watch for a reversal signal before assuming short-covering will take hold.


Comentarios
Aún no hay comentarios