
Market Overview for Osmosis/USDC (OSMOUSDC) on 2026-01-13
Summary
• Price tested key support near $0.0546 before rebounding.
• A bullish engulfing pattern formed at 05:00 ET, followed by consolidation.
• Volume spiked during the 23:30–00:15 ET window, coinciding with the largest price drop.
• RSI signaled oversold conditions briefly around 02:45 ET but failed to trigger a strong reversal.
• Volatility expanded during the 19:45–20:00 ET candle, with a 0.0559–0.0557 range.
Osmosis/USDC (OSMOUSDC) opened at $0.0562 on 2026-01-12 at 12:00 ET, hit a high of $0.0564, dipped to a low of $0.0546, and closed at $0.0549 on 2026-01-13 at 12:00 ET. The 24-hour trading session saw a total volume of 270,724.24 and a notional turnover of $15,046.08.
Structure & Formations
The price showed a strong bearish move from $0.0562 to $0.0546 during the 19:45–23:30 ET period, with a key support level appearing around $0.0546. A subsequent bullish engulfing candle at 05:00 ET indicated possible short-term reversal intentions, though price action remained range-bound for much of the session.
Moving Averages
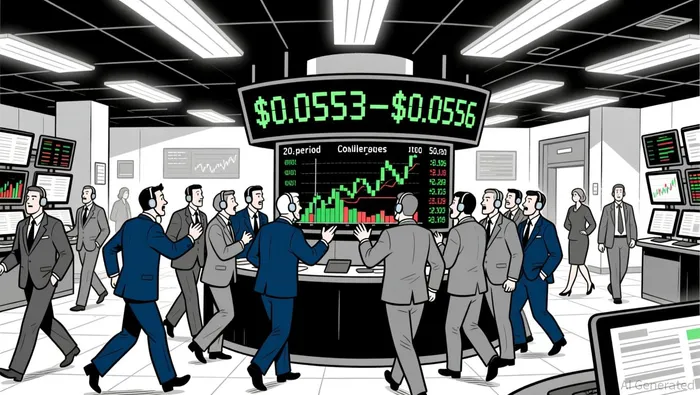
On the 5-minute chart, the 20-period and 50-period moving averages showed convergence near $0.0553–$0.0556, aligning with key consolidation zones. The price oscillated around this cluster, with little clear directional bias.
MACD & RSI
The MACD showed a bearish crossover during the 19:45–23:30 ET window, reinforcing the downward leg. RSI hit oversold territory below 30 around 02:45 ET, but failed to trigger a meaningful rebound, suggesting weakening bear momentum.
Bollinger Bands
Volatility expanded during the 19:45–20:00 ET candle as price dropped from $0.0559 to $0.0557, widening the bands. By 05:00 ET, the price moved above the mid-band during the bullish engulfing candle, but failed to maintain above the upper band.
Volume & Turnover
Volume spiked during the 23:30–00:15 ET window with the largest candle, which closed at $0.0548, suggesting aggressive liquidation. Price and turnover aligned during this period, reinforcing the bearish move.
Fibonacci Retracements
Applying Fibonacci retracements to the 0.0562–0.0546 swing, price found temporary support at 61.8% (~$0.0550), where it stalled briefly before pushing higher.
The market appears to be consolidating after the sharp dip into support, with potential for a test of the 0.0557–0.0559 range in the near term. Traders may look for a break above this level to signal a possible short-term recovery. However, a retest of the $0.0546 level could reignite bearish momentum if not defended.


Comentarios
Aún no hay comentarios