
Market Overview for Lisk/Bitcoin (LSKBTC)
Summary
• Price fluctuated between 2.26e-06 and 2.37e-06, with no clear trend.
• Volatility surged mid-day before consolidating near the 2.27e-06 level.
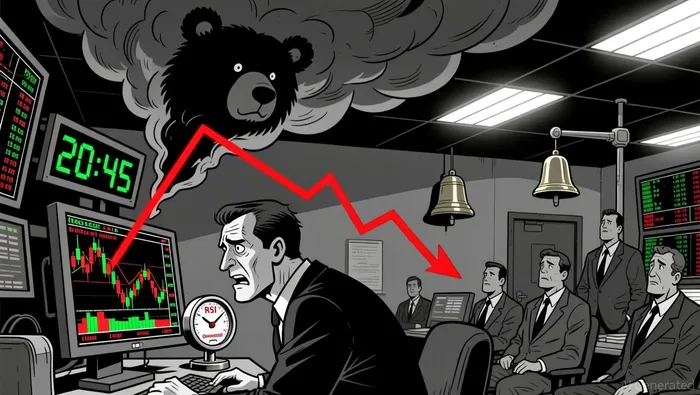
• A bearish engulfing pattern appeared at 20:45 ET, hinting at short-term bearish pressure.
• Volume spiked at 00:15 ET, coinciding with a sharp price pullback.
Lisk/Bitcoin (LSKBTC) opened at 2.29e-06 on 2025-12-15 at 12:00 ET, hit a high of 2.37e-06, and closed at 2.27e-06 on 2025-12-16 at 12:00 ET. The 24-hour volume totaled 49,214.5 with a turnover of 110.99.
Structure & Formations
The price formed a bearish engulfing candle at 20:45 ET, confirming a potential short-term reversal from bullish to bearish momentum. A key support level appears at 2.26e-06, while 2.31e-06 acted as a minor resistance. A long lower shadow at 21:15 ET suggests a failed bearish attempt.
Moving Averages
The 20-period and 50-period moving averages on the 5-minute chart remain below price, indicating a mildly bullish bias on shorter timeframes. On the daily chart, the 50-period MA crosses above the 200-period, suggesting a possible continuation of the broader uptrend.
**
MACD & RSI
The MACD crossed into negative territory during the late afternoon, indicating waning bullish momentum.
 The RSI dipped to 30 early on 12/16, pointing to oversold conditions, though price failed to follow through with a strong rebound, hinting at weak follow-through buying.
 Bollinger Bands
The price tested the lower Bollinger Band multiple times on 12/16, suggesting a high volatility environment with increased chances of mean reversion. A contraction in band width occurred overnight, followed by a sharp price expansion, signaling a potential breakout attempt.
Volume & Turnover
A sharp increase in volume at 00:15 ET aligned with a price drop from 2.31e-06 to 2.27e-06, suggesting bearish conviction. However, the subsequent consolidation with low volume implies buyers may be re-entering.
Fibonacci Retracements
The 61.8% Fibonacci level of the morning high (2.37e-06) aligns with 2.29e-06, where price stalled multiple times. A potential test of the 38.2% retracement at 2.25e-06 may provide a near-term floor.
The market may consolidate near key support levels in the next 24 hours, with a possible test of the 2.26e-06 floor. Traders should watch for a breakdown below that level, which could trigger further downside toward 2.24e-06. However, a rebound above 2.3e-06 may rekindle buying interest.


Comentarios
Aún no hay comentarios