
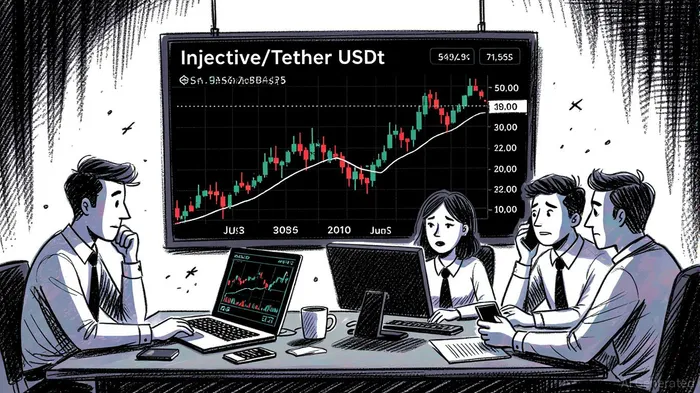
Market Overview for Injective/Tether USDt (INJUSDT)
• Price surged from $12.67 to $13.18, driven by strong late-night buying into early morning.
• Momentum confirmed by MACD crossover and RSI above 55, suggesting bullish continuation.
• Volatility expanded with BB %b above 1.0, signaling breakouts and elevated activity.
• Volume spiked during the bullish wave, but turnover dipped after 08:00 ET, hinting at profit-taking.
• A potential 50% retracement level lies at $13.05, with strong resistance near $13.18.
Injective/Tether USDtUSDC-- (INJUSDT) opened at $12.67 on 2025-09-05 at 12:00 ET and closed at $12.92 the following day at the same hour, reaching a high of $13.18 and a low of $12.67. Total volume across the 24-hour period was 115,302.69 INJ, with total turnover amounting to $1,492,184.94 USD (calculated using average price). The pair showed strong price action with a clear bullish bias in the latter half of the period.
Structure & Formations
The price formed a bullish engulfing pattern around 04:45–05:00 ET, confirming a reversal from a prior bearish trend. A key resistance level emerged at $13.18, where price stalled after a sharp rally. Support at $13.05 acted as a magnet multiple times, especially during 07:00–09:00 ET. A bearish harami pattern at 09:15–09:30 ET suggested a potential pullback.
Moving Averages
On the 15-minute chart, the 20SMA (at $12.95) crossed above the 50SMA (at $12.93), signaling a golden cross and reinforcing the bullish trend. On the daily chart, the 50DMA (at $12.88) acted as support during the late-night to early morning rally, while the 200DMA (at $12.92) was closely aligned with the final 24-hour close, indicating consolidation ahead of a potential breakout.
MACD & RSI
The MACD (12,26,9) crossed above the signal line during the late-night hours and remained bullish into the morning, with the histogram expanding, indicating strengthening momentum. The RSI rose to 60, avoiding overbought territory but suggesting sustained upward pressure. A RSI divergence occurred during 08:00–09:00 ET when price hit a low but RSI did not, signaling potential bearish reversal risks ahead.
Bollinger Bands
The Bollinger Bands (20-period, 2σ) widened sharply after 03:30 ET, reflecting increased volatility. Price briefly broke above the upper band (at $13.16) and closed near the midline, indicating re-entry into a consolidation phase. The BB %b (price as a percentage of the band) peaked at 1.18 during the rally, suggesting an overextended move and likely pullback.
Volume & Turnover
Volume spiked to 28,816.6 INJ between 03:30–04:00 ET, confirming the bullish breakout. However, notional turnover dropped after 08:00 ET, indicating profit-taking or market exhaustion. A volume divergence occurred near 09:00–09:30 ET when price hit a low but volume remained muted, suggesting weakening bearish conviction.
Fibonacci Retracements
On the 15-minute chart, a key 61.8% retracement level was reached at $13.06, where price stalled briefly. The 38.2% retracement level at $13.01 also acted as a minor pivot point during the 07:00–09:00 ET range. On the daily chart, the 61.8% retracement of the prior bearish swing is at $13.08, currently aligning with resistance.
Backtest Hypothesis
A backtesting strategy could be built around MACD crossovers on the 15-minute chart combined with volume confirmation and RSI divergence checks. Specifically, entries could be triggered on a golden cross with **RSI < 50** and **increasing volume**. Stop-loss levels may be placed at the **20SMA** or the **38.2% Fibonacci retracement**, depending on volatility. This approach would aim to capture **early-stage bullish momentum** while filtering out false signals via **volume and RSI checks**.


Comentarios
Aún no hay comentarios