
Market Overview for FTX Token/Tether (FTTUSDT)
Generado por agente de IAAinvest Crypto Technical RadarRevisado porAInvest News Editorial Team
jueves, 11 de diciembre de 2025, 2:19 pm ET1 min de lectura
USDT--
Price action formed a bearish trend from mid-session, with a long bearish engulfing pattern observed between 0.6836 and 0.6644.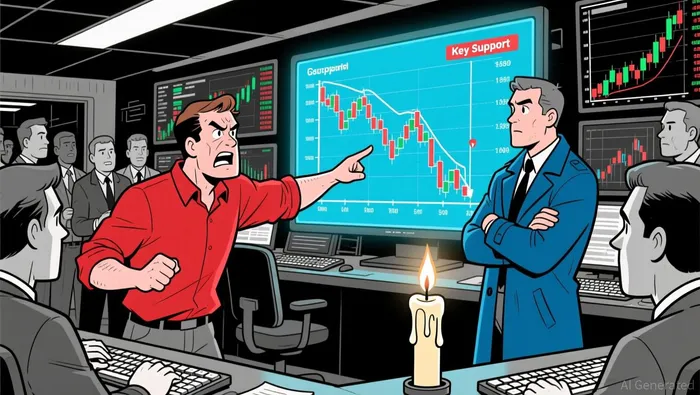 Key support levels at 0.6140–0.6170 held firm, and Fibonacci retracement levels of 61.8% (0.6225) and 38.2% (0.6285) were tested but failed. A potential bullish reversal candle emerged at 0.6221, with long wicks indicating indecision.
On the 5-minute chart, price closed below both the 20-EMA (0.6256) and 50-EMA (0.6261), suggesting short-term bearish bias. On the daily chart, the 50- and 200-day MA are not immediately available, but the bearish trendline has been in place for at least a few days, suggesting continuation risk.
RSI dropped to 28, indicating overbought bearish conditions and potential for a short-term bounce. MACD lines crossed bearishly in the morning, but a positive crossover at the end of the 24-hour period hints at a temporary reversal.
Bollinger Bands showed a period of contraction between 0.6250 and 0.6200, followed by a sharp expansion as price broke lower. Price closed near the lower band, suggesting potential mean reversion toward the 0.6230–0.6250 range.
Trading volume remained elevated during the late afternoon and evening hours, with a significant spike at 0.6140. Turnover also increased, suggesting increased participation from either panic selling or accumulation. A divergence between volume and price decline late in the session may indicate bearish exhaustion.
Price appears to be consolidating near key support at 0.6140–0.6170, with potential for a rebound into the 0.6225–0.6250 range. However, a break below 0.6140 could accelerate the downtrend. Investors should monitor RSI divergence and volume behavior for signs of trend continuation or reversal.
Summary
• Price declined from 0.6830 to 0.6221 over 24 hours, with bearish momentum.
• RSI and MACD signal oversold conditions, hinting potential short-term rebound.
• Volume surged near the close, suggesting possible accumulation or panic selling.
• Key support at 0.6140–0.6170 appears strong, with 0.6225 acting as near-term resistance.
• Bollinger Bands tightened ahead of the late rally, signaling rising volatility.
Market Overview
FTX Token/Tether (FTTUSDT) opened at 0.6707 on 2025-12-10 at 12:00 ET, reached a high of 0.6836, and closed at 0.6221 as of 12:00 ET on 2025-12-11. The 24-hour volume was 14,939,913.90, and notional turnover totaled approximately 9,154,030 USD (calculated using average price).
Structure & Formations
Price action formed a bearish trend from mid-session, with a long bearish engulfing pattern observed between 0.6836 and 0.6644.
Key support levels at 0.6140–0.6170 held firm, and Fibonacci retracement levels of 61.8% (0.6225) and 38.2% (0.6285) were tested but failed. A potential bullish reversal candle emerged at 0.6221, with long wicks indicating indecision. Moving Averages
On the 5-minute chart, price closed below both the 20-EMA (0.6256) and 50-EMA (0.6261), suggesting short-term bearish bias. On the daily chart, the 50- and 200-day MA are not immediately available, but the bearish trendline has been in place for at least a few days, suggesting continuation risk.
Momentum Indicators
RSI dropped to 28, indicating overbought bearish conditions and potential for a short-term bounce. MACD lines crossed bearishly in the morning, but a positive crossover at the end of the 24-hour period hints at a temporary reversal.
Volatility and Bollinger Bands
Bollinger Bands showed a period of contraction between 0.6250 and 0.6200, followed by a sharp expansion as price broke lower. Price closed near the lower band, suggesting potential mean reversion toward the 0.6230–0.6250 range.
Volume and Turnover
Trading volume remained elevated during the late afternoon and evening hours, with a significant spike at 0.6140. Turnover also increased, suggesting increased participation from either panic selling or accumulation. A divergence between volume and price decline late in the session may indicate bearish exhaustion.
Forward-Looking Outlook
Price appears to be consolidating near key support at 0.6140–0.6170, with potential for a rebound into the 0.6225–0.6250 range. However, a break below 0.6140 could accelerate the downtrend. Investors should monitor RSI divergence and volume behavior for signs of trend continuation or reversal.

Divulgación editorial y transparencia de la IA: Ainvest News utiliza tecnología avanzada de Modelos de Lenguaje Largo (LLM) para sintetizar y analizar datos de mercado en tiempo real. Para garantizar los más altos estándares de integridad, cada artículo se somete a un riguroso proceso de verificación con participación humana.
Mientras la IA asiste en el procesamiento de datos y la redacción inicial, un miembro editorial profesional de Ainvest revisa, verifica y aprueba de forma independiente todo el contenido para garantizar su precisión y cumplimiento con los estándares editoriales de Ainvest Fintech Inc. Esta supervisión humana está diseñada para mitigar las alucinaciones de la IA y garantizar el contexto financiero.
Advertencia sobre inversiones: Este contenido se proporciona únicamente con fines informativos y no constituye asesoramiento profesional de inversión, legal o financiero. Los mercados conllevan riesgos inherentes. Se recomienda a los usuarios que realicen una investigación independiente o consulten a un asesor financiero certificado antes de tomar cualquier decisión. Ainvest Fintech Inc. se exime de toda responsabilidad por las acciones tomadas con base en esta información. ¿Encontró un error? Reportar un problema

Comentarios
Aún no hay comentarios