
Market Overview for EigenLayer/Bitcoin (EIGENBTC): December 10, 2025
Summary
• Price declined from 5.7e-06 to 5.23e-06 over 24 hours, forming bearish continuation patterns.
• Key support tested near 5.23e-06, with volume surging as price dropped below 5.3e-06.
• RSI suggests oversold conditions, but MACD remains bearish with no sign of reversal.
• Volatility expanded, with Bollinger Bands widening and price hitting lower boundaries.
• Turnover increased at 5.3e-06 but failed to push price higher, hinting at weak buying pressure.
The EigenLayer/Bitcoin (EIGENBTC) pair opened at 5.66e-06 on December 9, peaked at 5.82e-06, and closed at 5.23e-06 on December 10. Daily volume totaled 64,181.16, with turnover of approximately $330,197.50.
Structure & Formations
Price moved in a bearish trend, forming multiple lower highs and lower lows. A key bearish engulfing pattern occurred near 5.7e-06 to 5.66e-06, followed by a long lower shadow at 5.3e-06 to 5.2e-06, suggesting rejection at lower levels. A possible support level may be forming at 5.23e-06, where the price found a floor.
Moving Averages
On the 5-minute chart, the 20SMA and 50SMA crossed bearishly, confirming the downtrend. Daily MAs are not computed here, but recent 5-minute momentum suggests price may continue to test the 50-day level before stabilizing.
MACD & RSI
MACD remained bearish with a negative histogram, reinforcing the downward momentum. 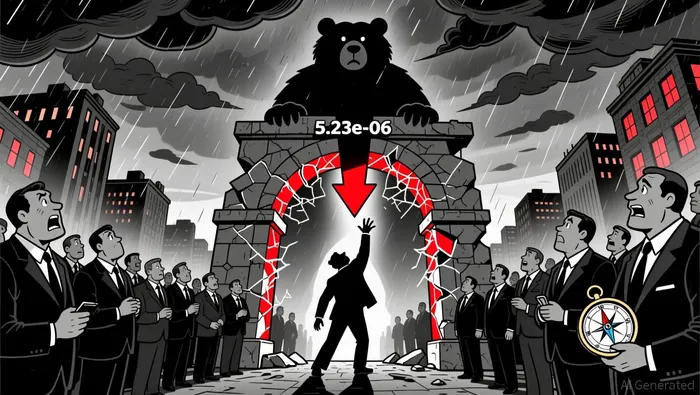 RSI fell into oversold territory around 30-35 during the late afternoon, but no strong reversal signal emerged, suggesting the downtrend may persist before a rebound.
Bollinger Bands
Volatility expanded sharply as price moved toward the lower band, hitting it at 5.23e-06. The band’s width increased, which may indicate a potential consolidation phase or a continuation of the trend.
Volume & Turnover
Volume surged as price moved below 5.3e-06, confirming bearish sentiment. However, higher turnover did not correspond with bullish price movement, indicating weak buying interest. A divergence between volume and price may suggest that further declines could be limited in the near term.
Fibonacci Retracements
On the 5-minute chart, price hit the 61.8% retracement level at 5.23e-06. This suggests a possible short-term support. If the price fails to hold this level, the next key target could be near 5.19e-06.
Looking ahead, if price holds above 5.23e-06, it may find short-term stability, but a break below this level could signal a deeper correction. Investors should monitor volume and RSI for signs of a potential reversal. As always, volatility remains high, and positions should be managed with caution.


Comentarios
Aún no hay comentarios