
Market Overview for Banana Gun/Bitcoin
Summary
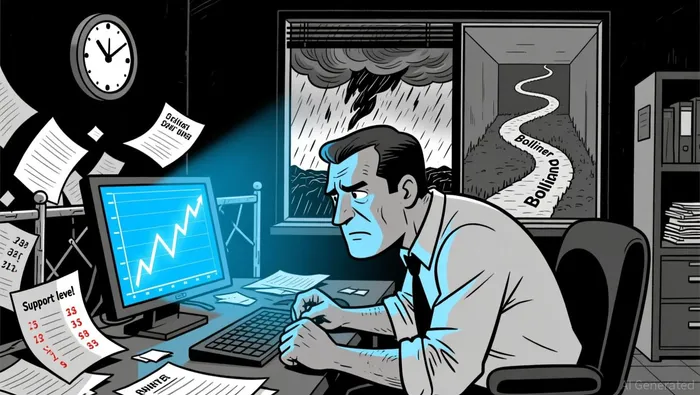
• Price action showed a steady decline with key support around 7.85e-05 holding.
• Volume spiked during the late session, confirming the bearish momentum.
• RSI entered oversold territory, suggesting potential for a near-term rebound.
Banana Gun/Bitcoin (BANANABTC) opened at 7.98e-05 on 2026-01-03 at 12:00 ET, reaching a high of 7.98e-05 and a low of 7.77e-05, closing at 7.85e-05 on 2026-01-04 at 12:00 ET. Total volume was 1,663.49 and turnover was approximately 0.1302 BTC for the 24-hour window.
Structure and Formations
Price action over the 24-hour period displayed a clear downward drift, with several instances of bearish continuation patterns, including inside bars and a confirmed breakdown below the 7.90e-05 level. A key support level at 7.85e-05 appears to have held multiple times, suggesting it could act as a temporary floor. A bullish engulfing pattern emerged briefly near 7.85e-05, hinting at possible short-covering or buying interest.
Moving Averages
On the 5-minute chart, the price closed below the 20- and 50-period moving averages, confirming a bearish bias. On the daily chart, the 50-period MA crossed below the 100-period MA, reinforcing the bearish setup.
Momentum Indicators
The RSI dipped into oversold territory below 30 at 7.85e-05, indicating short-term exhaustion in the bearish move and the potential for a bounce. MACD showed bearish divergence, with the histogram shrinking as price continued lower, suggesting weakening bearish momentum.
Volatility and Bollinger Bands
Bollinger Bands remained wide, indicating ongoing volatility. Price frequently traded near the lower band, especially in the late hours, suggesting increased bearish pressure. A contraction in band width is not observed, meaning volatility has not calmed significantly.
Volume and Turnover
Volume spiked during the late hours of the 24-hour window, especially around the breakdown of 7.86e-05, confirming the bearish move. Turnover aligned with the volume spikes, showing no divergence. The lack of buying interest during the low-volume periods implies a lack of conviction from bullish participants.
Fibonacci Retracements
Applying Fibonacci levels to the recent swing high of 7.98e-05 and the recent low of 7.77e-05, the 38.2% retracement level lies at 7.89e-05, and the 61.8% at 7.84e-05. The closing price near 7.85e-05 aligns closely with the 61.8% retracement level, suggesting potential for consolidation or a short-term rebound.
BANANABTC may see a pullback near the 7.85e-05 level in the next 24 hours, with the possibility of a test at 7.88e-05. Traders should remain cautious of further breakdowns, particularly below the 7.84e-05 level, which could open the door to extended bearish momentum.


Comentarios
Aún no hay comentarios