
Market Overview for Arweave/Bitcoin (ARBTC)
Generado por agente de IAAinvest Crypto Technical RadarRevisado porDavid Feng
viernes, 12 de diciembre de 2025, 9:15 pm ET1 min de lectura
AR--
At 12:00 ET–1 on 2025-12-11, Arweave/Bitcoin (ARBTC) opened at 4.38e-05 and traded between 4.23e-05 and 4.39e-05 before closing at 4.25e-05 at 12:00 ET. Total volume amounted to 1,509.18, with a notional turnover of 64.24.
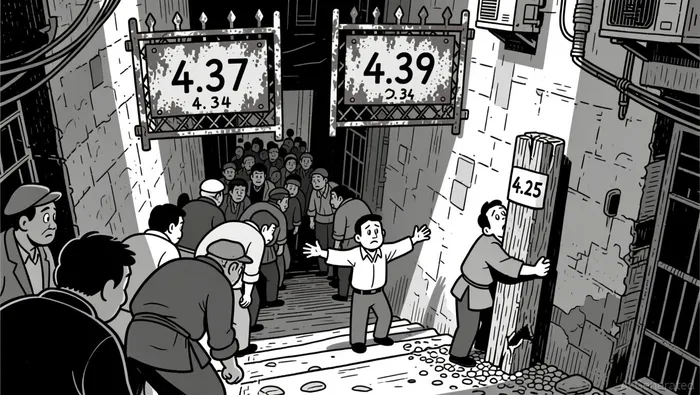
The 24-hour price action displayed a bearish flag pattern as price drifted lower within a narrow range. Key support appears at 4.25e-05, tested twice with mixed follow-through. A doji near 4.34e-05 at 05:45 ET signaled indecision. Resistance levels at 4.37e-05 and 4.39e-05 were tested multiple times but failed to hold.
On the 5-minute chart, the 20-period and 50-period moving averages remained in close proximity, suggesting a lack of clear momentum. The 50-period average is currently below the 100-period line on the daily chart, hinting at a possible bearish bias for longer-term holders.
The MACD remained below zero with a flat histogram, indicating a lack of momentum in the short term. RSI hovered around the 50 level, suggesting neither overbought nor oversold conditions. No significant divergence was observed between price and RSI.
Bollinger Bands constricted mid-day between 4.33e-05 and 4.37e-05, indicating a potential breakout or breakdown scenario. Price eventually drifted lower, closing below the mid-band, which could suggest a bearish continuation in the near term.
Volume remained generally low, with sporadic spikes after 15:30 ET as price broke below key support levels. Turnover followed a similar pattern, with a notable spike at 15:30 ET as price moved from 4.33e-05 to 4.26e-05. Price and turnover aligned during the late-session decline.
Applying Fibonacci to the recent 5-minute swing from 4.39e-05 to 4.23e-05, price appears to have found a short-term floor near 4.25e-05 (61.8% level). A break below this level could target the 38.2% retracement at 4.29e-05 for further downside.
BTC--
Summary
• Price drifted lower, forming a bearish flag pattern within a tightening consolidation range.
• Volume remained muted but spiked late in the session, hinting at potential support testing.
• RSI near neutral territory suggests limited overbought or oversold pressure, while MACD remained below zero.
• Bollinger Bands constricted mid-day, indicating a potential breakout or breakdown scenario.
Market Overview
At 12:00 ET–1 on 2025-12-11, Arweave/Bitcoin (ARBTC) opened at 4.38e-05 and traded between 4.23e-05 and 4.39e-05 before closing at 4.25e-05 at 12:00 ET. Total volume amounted to 1,509.18, with a notional turnover of 64.24.
Structure & Formations
The 24-hour price action displayed a bearish flag pattern as price drifted lower within a narrow range. Key support appears at 4.25e-05, tested twice with mixed follow-through. A doji near 4.34e-05 at 05:45 ET signaled indecision. Resistance levels at 4.37e-05 and 4.39e-05 were tested multiple times but failed to hold.
Moving Averages
On the 5-minute chart, the 20-period and 50-period moving averages remained in close proximity, suggesting a lack of clear momentum. The 50-period average is currently below the 100-period line on the daily chart, hinting at a possible bearish bias for longer-term holders.
Momentum Indicators
The MACD remained below zero with a flat histogram, indicating a lack of momentum in the short term. RSI hovered around the 50 level, suggesting neither overbought nor oversold conditions. No significant divergence was observed between price and RSI.
Bollinger Bands
Bollinger Bands constricted mid-day between 4.33e-05 and 4.37e-05, indicating a potential breakout or breakdown scenario. Price eventually drifted lower, closing below the mid-band, which could suggest a bearish continuation in the near term.
Volume and Turnover
Volume remained generally low, with sporadic spikes after 15:30 ET as price broke below key support levels. Turnover followed a similar pattern, with a notable spike at 15:30 ET as price moved from 4.33e-05 to 4.26e-05. Price and turnover aligned during the late-session decline.
Fibonacci Retracements
Applying Fibonacci to the recent 5-minute swing from 4.39e-05 to 4.23e-05, price appears to have found a short-term floor near 4.25e-05 (61.8% level). A break below this level could target the 38.2% retracement at 4.29e-05 for further downside.
The market appears to be consolidating ahead of a potential breakout, with key support levels likely to be tested in the next 24 hours. While price shows no immediate signs of reversal, traders should remain cautious of a breakdown below 4.25e-05 and consider managing risk accordingly.

Divulgación editorial y transparencia de la IA: Ainvest News utiliza tecnología avanzada de Modelos de Lenguaje Largo (LLM) para sintetizar y analizar datos de mercado en tiempo real. Para garantizar los más altos estándares de integridad, cada artículo se somete a un riguroso proceso de verificación con participación humana.
Mientras la IA asiste en el procesamiento de datos y la redacción inicial, un miembro editorial profesional de Ainvest revisa, verifica y aprueba de forma independiente todo el contenido para garantizar su precisión y cumplimiento con los estándares editoriales de Ainvest Fintech Inc. Esta supervisión humana está diseñada para mitigar las alucinaciones de la IA y garantizar el contexto financiero.
Advertencia sobre inversiones: Este contenido se proporciona únicamente con fines informativos y no constituye asesoramiento profesional de inversión, legal o financiero. Los mercados conllevan riesgos inherentes. Se recomienda a los usuarios que realicen una investigación independiente o consulten a un asesor financiero certificado antes de tomar cualquier decisión. Ainvest Fintech Inc. se exime de toda responsabilidad por las acciones tomadas con base en esta información. ¿Encontró un error? Reportar un problema

SOBRE NOSOTROS
Nuestra historiaAutores de noticiasBase de conocimientosPolítica de privacidadTérmino de usoDescargo de responsabilidad de corretaje de tercerosTérminos de uso de AIMEDivulgaciones de riesgos de AInvest AICarrerasCONTÁCTENOS
Email: support@ainvest.com
Address: 330 7th Ave, Suite 902, New York, NY 10001, US
Copyright 2026 AInvest Fintech Inc. All rights reserved.
Comentarios
Aún no hay comentarios