
Market Overview for Arkham/Tether (ARKMUSDT)
Summary
• Price traded between $0.187 and $0.195, forming consolidation and bullish reversal patterns near key levels.
• Momentum waned after a strong early morning rally, with RSI showing overbought conditions.
• Volume surged during the breakout attempt, confirming short-term bullish bias but showing mixed conviction.
• Volatility expanded during the session, with price hovering near upper Bollinger Bands in the late ET hours.
• Fibonacci retracements suggest potential support at $0.189 and resistance at $0.193 in the near term.
Arkham/Tether (ARKMUSDT) opened at $0.189 and traded between $0.187 and $0.195 over the past 24 hours, closing at $0.192 near the 12:00 ET mark. Total volume reached ~4.7 million contracts, with turnover of ~$903,000.
Structure & Formations
Price consolidated between $0.189 and $0.193 for much of the session before attempting a breakout above resistance. A bullish engulfing pattern formed near $0.191, followed by a long lower shadow at $0.189, signaling buyers stepping in on dips.
Moving Averages
On the 5-minute chart, price remained above the 20-period and 50-period moving averages, indicating short-term bullish bias. Daily timeframe averages were not directly accessible, but intraday momentum supports a potential test of the 50-day MA.
MACD & RSI
The MACD line crossed above the signal line in the early morning, confirming a short-term bullish trend. RSI spiked to overbought levels above 70 during the $0.191–$0.195 rally, suggesting potential for a pullback or consolidation.
Bollinger Bands
Volatility expanded in the early ET hours, with price reaching the upper band during the breakout attempt. 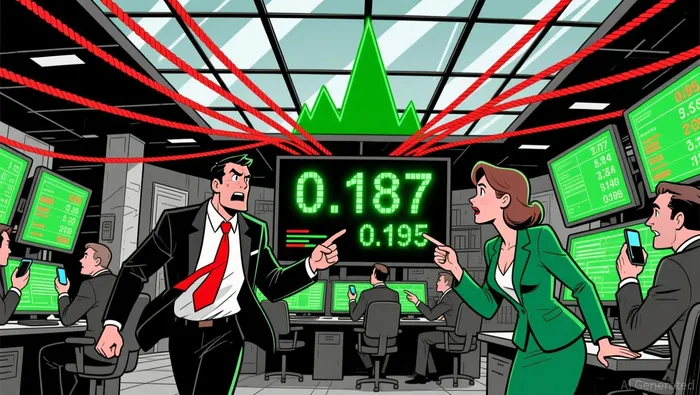 Price then drifted toward the middle band by midday, indicating waning momentum.
Volume & Turnover
Volume spiked during the $0.191–$0.195 rally, with the largest turnover seen during the first hour of the trading day. Notional turnover aligned with price highs, suggesting genuine buying pressure rather than wash trading.
Fibonacci Retracements
A 5-minute Fibonacci applied to the recent $0.187–$0.195 move identified key support near $0.189 (38.2%) and resistance at $0.193 (61.8%). Price may test these levels in the coming 24 hours.
Price appears to be in a short-term bullish phase, but momentum indicators suggest caution ahead. A sustained break above $0.195 could extend the rally, but traders should watch for divergence in volume and RSI. Risk of a pullback to $0.187 remains if buyers fail to hold key support.


Comentarios
Aún no hay comentarios