
Market Overview for Arbitrum/Bitcoin (ARBBTC)
Summary
• Price tested resistance near 2.17e-06 before consolidating.
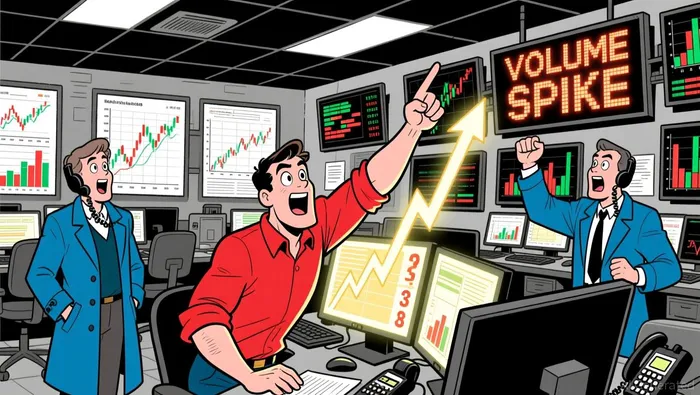
• High volume surges occurred during key price moves.
• RSI suggests moderate momentum with no clear overbought signal.
• Bollinger Bands show mixed volatility with contraction early in the session.
• A bullish engulfing pattern formed around 00:15 ET with confirmation.
Arbitrum/Bitcoin (ARBBTC) opened at 2.12e-06 on 2025-12-23 12:00 ET, reached a high of 2.22e-06, and closed at 2.17e-06 on 2025-12-24 12:00 ET, with a low of 2.11e-06. Total volume for the 24-hour period was 682,517.2, and notional turnover reached 138.9 ARB (estimating based on volume and average price).
Structure & Formations
Price found strong resistance at 2.17e-06, where a bullish engulfing pattern formed on the 5-minute chart at 00:15 ET, followed by a breakout attempt. A key support level at 2.12e-06 was retested multiple times, especially in late evening hours. A doji at 02:15 ET suggests indecision.
Moving Averages
On the 5-minute chart, the 20-period MA crossed above the 50-period MA, indicating short-term bullish momentum. On the daily chart, price remains above the 200-period MA, suggesting a longer-term bullish bias.
MACD & RSI
MACD remained in positive territory after 00:15 ET, indicating bullish momentum. RSI fluctuated between 50 and 60, showing moderate strength without entering overbought territory. A divergence between RSI and price was observed during the 06:00–09:00 ET consolidation period.
Bollinger Bands
Price expanded outside the upper Bollinger Band at 00:15 ET during the bullish breakout, indicating increased volatility. However, the bands constricted earlier in the session, suggesting a potential range-bound period. Price has since settled within the band range.
Volume & Turnover
Volume spiked significantly at 00:15 ET during the breakout and again at 16:45 ET during a secondary rally. Turnover aligned with volume surges, confirming the breakout. However, volume remained relatively low during consolidation periods, pointing to reduced conviction.
Fibonacci Retracements
On the 5-minute chart, price found support at the 61.8% Fibonacci level of the 2.11e-06 to 2.22e-06 rally. A 38.2% retracement at 2.17e-06 saw a brief rejection before price resumed higher, indicating a possible continuation of the upward move.
Looking ahead, price may test the 2.17e-06 level again or attempt a push toward 2.22e-06. Traders should monitor volume during key breakouts and be cautious of potential consolidation or reversal patterns if resistance holds.


Comentarios
Aún no hay comentarios