
Market Overview for Ankr/Tether (ANKRUSDT)
Summary
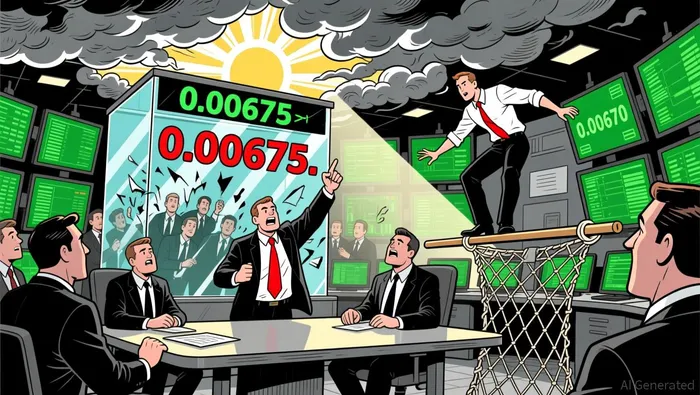
• ANKRUSDTANKR-- formed bullish consolidation before an upward breakout near 0.00675.
• Price action showed a 5.6% range with 0.00670 as a key 5-min support.
• Volume spiked during the 5-hour window from 04:00–09:00 ET, aligning with price strength.
• RSI peaked near overbought during the 05:30–07:00 ET window but did not trigger a reversal.
• Bollinger Bands narrowed overnight, suggesting reduced volatility ahead of a potential move.
At 12:00 ET−1, Ankr/Tether (ANKRUSDT) opened at 0.00666, hit a 24-hour high of 0.00682, and closed at 0.00668 by 12:00 ET. The low was 0.00660. Total 24-hour volume was 25,215,661.3 units, with a notional turnover of 169,919.8 USDT.
Structure & Formations
Price showed a bullish consolidation pattern during the overnight session, with a breakout above 0.00675 followed by a test of that level for confirmation. A 5-minute doji formed near 0.00679 during the early morning hours, suggesting indecision after an upward thrust. The 0.00670 level served as a recurring support, with multiple bounces reinforcing its relevance.
Moving Averages
On the 5-minute chart, the 20-period and 50-period moving averages crossed into a bullish configuration after 03:00 ET, supporting the morning breakout. On the daily chart, the 50-period MA remained below the 200-period MA, indicating a longer-term bearish trend despite the 24-hour strength.
Momentum and Volatility
RSI reached 70 during the 05:30–06:00 ET window, indicating overbought conditions but failed to trigger a reversal, suggesting continued bullish momentum. Bollinger Bands tightened during the overnight hours, pointing to a potential increase in volatility. MACD remained in positive territory during the bullish phase, confirming the upward bias.
Volume and Turnover
Volume and turnover surged during the 04:00–09:00 ET window, coinciding with the price breakout and consolidation. The increase in volume during these hours suggests genuine buying pressure rather than speculative noise. A slight divergence occurred between price and volume in the late morning, signaling caution for further aggressive moves.
Key Levels and Fibonacci Retracements
Fibonacci retracement levels from the overnight low to the morning high indicated 0.00673 as a critical 38.2% level, which was respected during the pullback. The 0.00660 level acted as a strong 61.8% retracement and a key support on the daily chart.
The market appears to be setting up for a potential short-term test of 0.00682, with the 0.00675–0.00678 range likely to see renewed interest. However, a failure to hold above 0.00668 in the next 24 hours could trigger a retest of key 5-min support levels. Investors should remain cautious around overbought RSI conditions and watch for divergences in volume.


Comentarios
Aún no hay comentarios