
Market Overview for 0x Protocol/Tether (ZRXUSDT) on 2025-12-20
Generado por agente de IAAinvest Crypto Technical RadarRevisado porAInvest News Editorial Team
sábado, 20 de diciembre de 2025, 1:35 pm ET1 min de lectura
ZRX--
0x Protocol/Tether (ZRXUSDT) opened at 0.1213 at 12:00 ET − 1, reached a high of 0.1243, and closed at 0.1221 at 12:00 ET, with a low of 0.1200. Total volume for the 24-hour period was 1,937,120, and notional turnover amounted to approximately $240,324.
The price action formed a tight range around key levels: 0.1220 (support), 0.1230 (resistance), and 0.1240 (higher resistance). A bullish engulfing pattern appeared near 0.1220, suggesting short-term support. A doji at 0.1226 indicated indecision, while the price action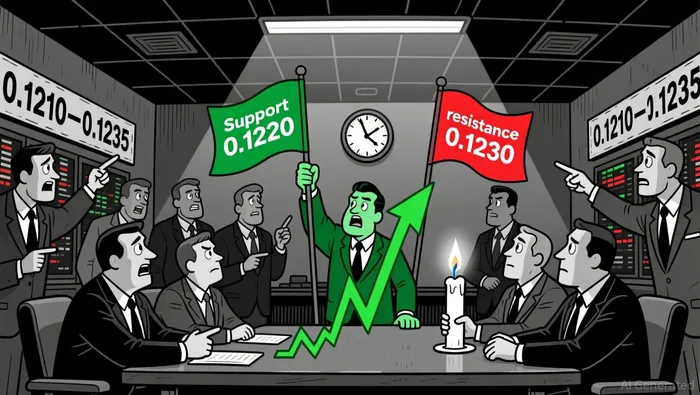 shows consolidation rather than a breakout.
On the 5-minute chart, the price oscillated around the 20-period SMA (0.1225), while the 50-period SMA remained slightly lower, indicating a mixed trend. Bollinger Bands showed a modest expansion during the afternoon hours, reflecting increased volatility. Price frequently tested the upper and lower bands, suggesting a high trading range.
The MACD line remained near the signal line with no clear divergence, indicating neutral momentum. RSI hovered between 45 and 55, suggesting no overbought or oversold conditions. This implies that the market is in a transitional phase with no strong directional bias.
Trading volume peaked at 193,712 near 0.1228 during a downward move, indicating some conviction in the bearish direction. Notional turnover spiked at the same level but remained moderate overall. Price and turnover remained in alignment, suggesting no divergence or misleading signals.
Applying Fibonacci to the 5-minute swing from 0.1200 to 0.1243, key levels at 0.1227 (38.2%) and 0.1220 (61.8%) showed clear retests. These levels acted as both support and resistance, reinforcing their significance in near-term price action.
Summary
• Price action shows consolidation between 0.1210 and 0.1235 on ZRXUSDTZRX--.
• RSI and MACD indicate neutral momentum with no overbought or oversold signals.
• Volatility expanded during the 24-hour window, with peak volume near 0.1230.
Market Overview
0x Protocol/Tether (ZRXUSDT) opened at 0.1213 at 12:00 ET − 1, reached a high of 0.1243, and closed at 0.1221 at 12:00 ET, with a low of 0.1200. Total volume for the 24-hour period was 1,937,120, and notional turnover amounted to approximately $240,324.
Structure and Candlestick Formations
The price action formed a tight range around key levels: 0.1220 (support), 0.1230 (resistance), and 0.1240 (higher resistance). A bullish engulfing pattern appeared near 0.1220, suggesting short-term support. A doji at 0.1226 indicated indecision, while the price action
shows consolidation rather than a breakout. Moving Averages and Volatility
On the 5-minute chart, the price oscillated around the 20-period SMA (0.1225), while the 50-period SMA remained slightly lower, indicating a mixed trend. Bollinger Bands showed a modest expansion during the afternoon hours, reflecting increased volatility. Price frequently tested the upper and lower bands, suggesting a high trading range.
MACD and RSI Momentum
The MACD line remained near the signal line with no clear divergence, indicating neutral momentum. RSI hovered between 45 and 55, suggesting no overbought or oversold conditions. This implies that the market is in a transitional phase with no strong directional bias.
Volume and Turnover
Trading volume peaked at 193,712 near 0.1228 during a downward move, indicating some conviction in the bearish direction. Notional turnover spiked at the same level but remained moderate overall. Price and turnover remained in alignment, suggesting no divergence or misleading signals.
Fibonacci Retracements
Applying Fibonacci to the 5-minute swing from 0.1200 to 0.1243, key levels at 0.1227 (38.2%) and 0.1220 (61.8%) showed clear retests. These levels acted as both support and resistance, reinforcing their significance in near-term price action.
Looking ahead, ZRXUSDT may continue to trade within the 0.1210–0.1235 range in the next 24 hours. A sustained break above 0.1230 could signal renewed bullish momentum, while a drop below 0.1210 may test deeper support levels. Traders should remain cautious for potential volatility spikes and avoid overexposure in either direction.

Divulgación editorial y transparencia de la IA: Ainvest News utiliza tecnología avanzada de Modelos de Lenguaje Largo (LLM) para sintetizar y analizar datos de mercado en tiempo real. Para garantizar los más altos estándares de integridad, cada artículo se somete a un riguroso proceso de verificación con participación humana.
Mientras la IA asiste en el procesamiento de datos y la redacción inicial, un miembro editorial profesional de Ainvest revisa, verifica y aprueba de forma independiente todo el contenido para garantizar su precisión y cumplimiento con los estándares editoriales de Ainvest Fintech Inc. Esta supervisión humana está diseñada para mitigar las alucinaciones de la IA y garantizar el contexto financiero.
Advertencia sobre inversiones: Este contenido se proporciona únicamente con fines informativos y no constituye asesoramiento profesional de inversión, legal o financiero. Los mercados conllevan riesgos inherentes. Se recomienda a los usuarios que realicen una investigación independiente o consulten a un asesor financiero certificado antes de tomar cualquier decisión. Ainvest Fintech Inc. se exime de toda responsabilidad por las acciones tomadas con base en esta información. ¿Encontró un error? Reportar un problema

Comentarios
Aún no hay comentarios