
Litecoin's Near-Term Price Trajectory: A Deep Dive into Support-Level Analysis and Risk Mitigation Strategies
Litecoin (LTC) has long been a cornerstone of the cryptocurrency market, often dubbed the "silver to Bitcoin's gold." As of September 2025, the asset is navigating a pivotal phase, with its price hovering near critical support and resistance levels that could dictate its near-term trajectory. For investors, understanding these technical dynamics-and the associated risks-is essential to making informed decisions.
Current Price and Market Sentiment
Litecoin's price currently stands at $118.08, with a market capitalization of $8.99 billion, placing it 19th in the global crypto rankings, according to a Changelly forecast. Despite a short-term dip projected for October 5, 2025, the broader sentiment remains cautiously optimistic, with 76% of market participants expressing bullish expectations, according to the same Changelly forecast. This optimism is partly fueled by Litecoin's position above its 50-day Simple Moving Average (SMA) at $112.48, a key indicator of short-to-medium-term strength, according to a Currency Analytics report. However, the price remains below the 200-day SMA, a bearish signal that has persisted for months, according to a DigitalCoinPrice forecast.
Critical Support and Resistance Levels
Technical analysis underscores the importance of $112.48 as a pivotal support level. This 50-day SMA acts as a dynamic floor, and a break below it could trigger a cascade of bearish momentum, targeting $106.70 and potentially $87.12, as noted in the Currency Analytics report. Conversely, a breakout above the $119.58 resistance level-aligned with the 20-day SMA-could propel LTCLTC-- toward the Bollinger Band upper limit at $130.28 and even the 52-week high of $137.04, per the Currency Analytics analysis.
The $112–$115 range is particularly critical, as it encompasses both the 9-day Exponential Moving Average (EMA) at $112.68 and the 50-day SMA. These levels form a "demand zone" that has historically attracted buyers, according to a Financial Analyst report. A sustained close below this range would invalidate the bullish case, while a rebound here could reinforce the asset's resilience.
Risk Mitigation Strategies
For investors, managing risk in this volatile environment requires a disciplined approach:
1. Stop-Loss Orders: Positioning stop-loss orders just below $112.48 can limit downside exposure if the 50-day SMA fails to hold.
2. Take Profits at Resistance: Traders targeting a breakout above $119.58 should consider partial profit-taking at $125–$130, as this range aligns with historical resistance and Fibonacci retracement levels, as the Currency Analytics report notes.
3. Monitor Technical Indicators: The MACD histogram currently reflects short-term bearish momentum, while the RSI hovers near neutral territory (around 45), suggesting a potential equilibrium, per the Currency Analytics analysis. A move above 50 on the RSI would confirm bullish momentum, whereas a drop below 30 could signal further weakness.
Whale Activity and Institutional Signals
On-chain data from Santiment reveals that large LTC holders-often interpreted as institutional investors-have accumulated 660,000 tokens since September 20, 2025, according to an Elevenews report. That report also notes LitecoinLTC-- finding support at the 200-day EMA at $103.24, reinforcing the likelihood of a technical rebound. However, daily RSI readings below 50 indicate lingering bearish pressure, necessitating a breakout above $119.58 to validate a bullish continuation, as highlighted in the Elevenews coverage.
Catalysts for the Near Term
Beyond technicals, regulatory developments could act as a catalyst. A 90–95% probability of ETF approval by October 2025 is widely anticipated, with such a move likely to drive institutional adoption and liquidity, according to a Cash2Bitcoin outlook. That outlook estimates this could push LTC toward $134.19 by mid-2025.
Conclusion
Litecoin's near-term trajectory hinges on its ability to reclaim the $116–$120 resistance zone while maintaining volume expansion during breakout attempts. A failure to hold above $112.48 would shift the bias bearish, whereas a successful breakout above $119.58 could unlock gains toward $130 and beyond. Investors should remain vigilant, leveraging technical indicators and institutional signals to navigate this critical juncture.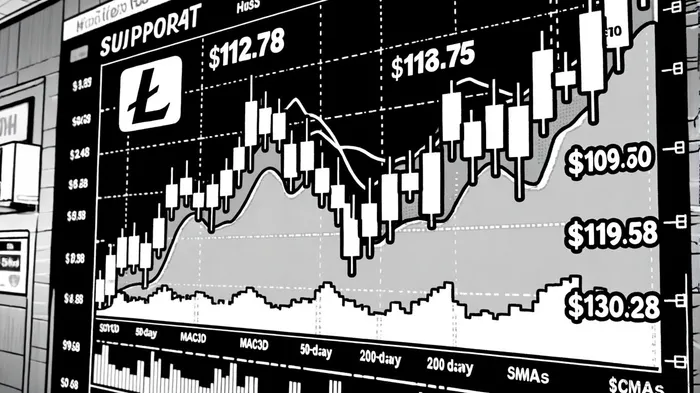


Comentarios
Aún no hay comentarios