
Litecoin's Critical Price Levels and Reversal Opportunities: A Technical and Sentiment-Driven Analysis
Litecoin's Critical Price Levels and Reversal Opportunities: A Technical and Sentiment-Driven Analysis
Litecoin (LTC) has emerged as a focal point for both retail and institutional traders in October 2025, with its price action and on-chain metrics painting a complex picture of potential bullish continuation and looming risks. This analysis synthesizes technical indicators, market sentiment trends, and reversal patterns to outline actionable strategies for short-term traders navigating LTC's volatile landscape.
Key Support and Resistance Levels: The Foundation of LTC's Technical Outlook
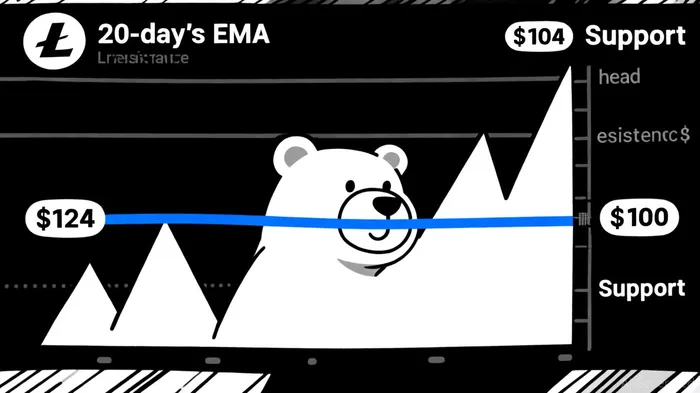
Litecoin's price structure in October 2025 is anchored by critical support and resistance levels that define its near-term trajectory. The 20-day Exponential Moving Average (EMA) at $115.20 remains a pivotal short-term support level, with historical data showing its role as a floor for price appreciation, according to a Litecoin path analysis. Traders are closely monitoring whether LTCLTC-- can sustain its position above this level to avoid a retest of the $115 market gap or a pullback to the $100 psychological threshold, according to the same LitecoinLTC-- path analysis.
On the resistance side, the $124 supply zone has historically caused short-term rejections, but a breakout above this level could catalyze a move toward $135, as noted in the Litecoin path analysis. This zone is further reinforced by the 20-day moving average and Bollinger upper band at $124.53, per a BTCC outlook. A decisive close above $130, meanwhile, could trigger FOMO-driven buying, while failure to hold $125 may invite profit-taking, according to the BTCC outlook.
Market Sentiment: Bullish Momentum Amid Structural Risks
Market sentiment for LTC in October 2025 is cautiously optimistic, driven by a mix of technical strength and institutional developments. Litecoin is currently trading at $106.19, below its 20-day moving average of $110.67, but the MACD divergence of 5.37 and RSI at 60.3 suggest underlying bullish momentum, according to the Litecoin path analysis. Whale accumulation activity-$31.6 million in LTC moved to accumulation addresses since mid-September-further signals confidence in the asset's near-term prospects, as noted by the same Litecoin path analysis.
However, structural risks persist. The OI-Weighted Funding Rate has dropped to 0.0142%, indicating a surge in bearish bets, per an FXStreet report. A sharp pullback could occur if the $130 level is broken, especially as the RSI is currently in overbought territory, according to the FXStreet report. Regulatory delays for a potential spot ETF and macroeconomic headwinds, such as Bitcoin's market dominance, also pose challenges, according to a CoinMarketCap prediction.
Reversal Patterns: Navigating Short-Term Volatility
Litecoin's price action in October 2025 has displayed a mix of bullish and bearish reversal patterns, offering both opportunities and cautionary signals. A bearish three-black crow pattern on the daily chart-formed after LTC's 22% drop from $134.40 to $84.79-suggests a potential retest of the $100 support level, according to a CryptoNewsZ analysis. Conversely, a descending triangle on the 1-hour chart hints at a bullish breakout, with a target range of $95–$107, as outlined in the CryptoNewsZ analysis.
Longer-term, an inverse head-and-shoulders pattern with a neckline near $134 could propel LTC to $165 if confirmed, according to the BTCC outlook. This pattern, combined with a triple zigzag correction completion and bullish RSI divergence, underscores the asset's potential for a sustained rally, per a BraveNewCoin analysis.
Trading Strategy: Balancing Risk and Reward
For short-term traders, LTC's price structure offers defined entry and exit points. A bullish strategy could involve entering long positions above $124 with a stop-loss below the 20-day EMA ($115.20), targeting $135 as a primary profit objective, according to the Litecoin path analysis. Conversely, a bearish approach might focus on shorting LTC if it breaks below $115, with a stop-loss above the $124 resistance zone, as noted in the CryptoNewsZ analysis.
Retail traders should also monitor the $130 level for FOMO-driven buying and the $100 psychological support for potential rebounds, per the BTCC outlook. Given the mixed signals from technical indicators and on-chain metrics, position sizing and risk management remain critical.
Conclusion: A Tipping Point for Litecoin
Litecoin's October 2025 price action reflects a market at a crossroads. While institutional adoption, ETF speculation, and technical momentum favor a bullish case, structural risks like bearish funding rates and regulatory uncertainty cannot be ignored. Traders who closely monitor key levels-$115, $124, and $135-and adapt to evolving reversal patterns will be best positioned to capitalize on LTC's volatility.


Comentarios
Aún no hay comentarios