
The Late-Afternoon Selloff in Financial Stocks: A Buying Opportunity or a Warning Sign?
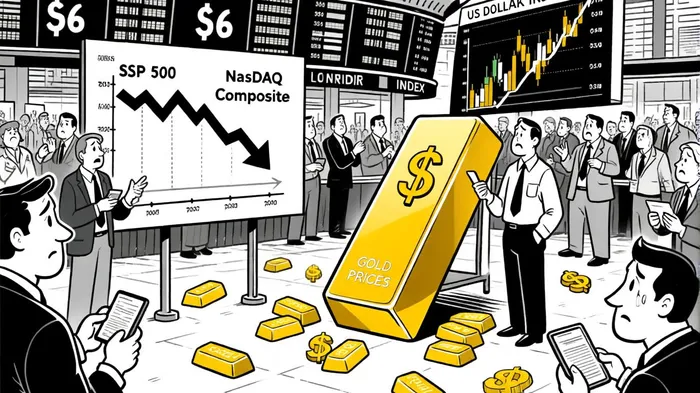
The recent late-afternoon selloff in U.S. financial stocks on September 2, 2025, has sparked intense debate among investors and analysts. With the S&P 500 and Nasdaq Composite falling 0.69% and 0.82% respectively, the market's reaction to geopolitical uncertainty, legal challenges to Trump-era tariffs, and seasonal volatility has raised critical questions: Is this a temporary correction offering a buying opportunity, or a harbinger of deeper risks? To answer this, we must dissect the interplay of market sentiment and technical indicators, contextualized within historical patterns.
Market Sentiment: Pessimism and Safe-Haven Flows
Investor sentiment has deteriorated sharply in recent weeks. The AAII Sentiment Survey reveals a drop in bullish sentiment to 42.92%, while CNN's Fear & Greed Index underscores a risk-off climate driven by elevated volatility (VIX) and a widening put/call ratio, according to YCharts investor sentiment. These metrics reflect growing unease about macroeconomic headwinds, including the legal uncertainty surrounding Trump's tariffs and the historically weak performance of markets in September, as noted in the EconCurrents market close.
The selloff has also triggered a flight to safety. Gold prices surged to $3,600 an ounce, while the 10-year U.S. Treasury yield climbed to 4.27%, signaling a shift toward defensive assets, a trend highlighted by the EconCurrents note. This behavior aligns with historical precedents: During periods of geopolitical or regulatory uncertainty, investors often abandon cyclical sectors like financials and technology for safe havens, as shown in a historical RSI backtest.
Technical Indicators: Overbought Conditions and Volatility Signals
Technical analysis provides further clarity. The Relative Strength Index (RSI) for financial stocks moved into oversold territory (below 30) following the selloff, suggesting potential short-term reversals, a development reported by EconCurrents. Bollinger Bands, meanwhile, highlighted extreme volatility, with prices oscillating between upper and lower bands-a pattern often preceding trend exhaustion or breakouts, also noted by EconCurrents.
However, bearish signals persist. Rising wedge patterns in the S&P 500 and Nasdaq Composite indicate continued pressure, while the Parabolic SAR (PSAR) confirms a bearish bias with dots positioned above asset prices, consistent with recent readings from YCharts' investor-sentiment series. These indicators caution against premature optimism, even as some analysts argue that oversold conditions may create tactical entry points for disciplined investors, according to Morgan Stanley commentary.
Historical backtesting of a similar strategy from 2022 to 2025 reveals mixed results. A strategy of buying financial stocks when RSI is oversold and holding for 30 days generated a modest absolute gain but underwhelming risk-adjusted performance (Sharpe ≈ 0.18), with significant drawdowns (~21%) and average winning trades (+5%) only slightly outpacing average losses (-5.4%). These findings underscore the limitations of relying solely on RSI as a trigger, as the strategy's edge derives more from win rate than payoff skew, a caveat highlighted in the EconCurrents note.
Historical Context: The September Effect and Recovery Patterns
September has long been a volatile month for equities. Since 1950, the S&P 500 has averaged a -0.6% return in September, with the NASDAQ performing even worse at -0.9%, according to YCharts' historical sentiment series. The selloff on September 2, 2025, fits this pattern, exacerbated by the legal challenges to Trump's tariffs and a cooling labor market, as discussed in the EconCurrents market close.
Yet history also shows resilience. LPL Research notes that 70% of post-1950 market corrections have led to double-digit gains within 12 months, with bull markets averaging over three years in duration, a point summarized in the EconCurrents analysis. The current pullback of 17% since late February, while significant, may not signal a bear market if corporate earnings continue to outperform expectations-as they have, with S&P 500 operating margins hitting 17.9%, an observation echoed in Morgan Stanley's commentary.
Divergence Between Fundamentals and Sentiment
A key tension exists between strong corporate fundamentals and fragile investor sentiment. Despite the selloff, the S&P 500 remains near record highs, supported by AI-driven growth and expectations of Fed rate cuts, according to Magellan market commentary. However, the sharply bearish AAII Bull-Bear ratio suggests a potential overcorrection, as markets often rebound when sentiment reaches extreme pessimism-a dynamic noted in Morgan Stanley's equity commentary.
For investors, this divergence presents a dilemma. On one hand, the selloff offers opportunities to acquire undervalued assets in resilient sectors. On the other, the risks of prolonged volatility-driven by unresolved trade policy disputes and inflationary pressures-cannot be ignored, as argued in a MarketMinute analysis.
Conclusion: Balancing Caution and Opportunity
The late-afternoon selloff in financial stocks is neither a clear buy signal nor an unequivocal warning. It reflects a complex interplay of macroeconomic uncertainty, seasonal volatility, and technical exhaustion. While historical patterns suggest eventual recovery, the path forward depends on resolving the legal and geopolitical risks that triggered the selloff.
For now, investors should adopt a measured approach. Those with a long-term horizon may find value in selectively adding to high-quality positions, particularly in sectors showing strong earnings resilience. However, overexposure to risk remains unwise until clarity emerges on trade policies and inflation trends. In this environment, patience and disciplined risk management are paramount.

Comentarios
Aún no hay comentarios