
JasmyCoin (JASMY) Price Action and Support Level Test: A Technical and On-Chain Analysis
JasmyCoin (JASMY) has recently drawn significant attention from traders and analysts due to its complex price action and conflicting signals between technical reversal patterns and on-chain sentiment. As the token tests critical support levels and navigates a potential bullish breakout, understanding the interplay between chart patterns and on-chain metrics is essential for assessing its near-term trajectory.
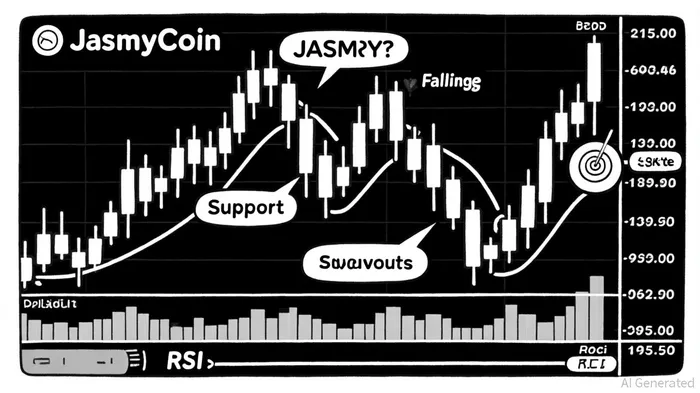
Technical Reversal Patterns: A Mixed Signal
JASMY's price action has formed a falling wedge pattern on the daily chart, a classic bullish reversal formation. The wedge's lower boundary has been tested near $0.00380, coinciding with the 200-day moving average, which has acted as a strong support level [1]. A successful breakout above the wedge's upper boundary at $0.00500 could target Fibonacci retracement levels such as $0.024 (0.618) and $0.03477, with further upside potential extending to $0.0580 [2].
Concurrently, an inverse head-and-shoulders pattern has emerged, with the neckline broken at $0.01709. This pattern, confirmed by rising volume, suggests a potential rally toward $0.02007 and beyond [3]. However, this optimism is tempered by a double-top pattern at $0.041, which, if confirmed, could trigger a bearish correction toward $0.028 [4]. The RSI for JASMYJASMY-- currently sits at 42.90, indicating neutral to slightly oversold conditions, while the Stochastic Oscillator suggests short-term exhaustion in the bearish trend [5].
On-Chain Sentiment: Bearish Undercurrents
Despite bullish technical indicators, on-chain data paints a more cautious picture. According to IntoTheBlock, large transactions have plummeted by 10% since December 2024, dropping from 387 to just 29 in recent weeks. New and active addresses have also declined by 1.27% and 15%, respectively, signaling reduced market participation [6]. These metrics align with a broader bearish trend, as JASMY's price has fallen below the 50% Fibonacci retracement level and the 50-period moving average [7].
The Net Unrealized Profit/Loss (NUPL) metric, though not explicitly quantified for JASMY in recent reports, is inferred to be in a net loss zone based on its price action. NUPL values below zero typically indicate widespread unrealized losses, a precursor to capitulation and potential price bottoms [8]. However, the absence of a clear NUPL signal underscores the need for caution, as prolonged bearish sentiment could delay a reversal.
Fundamental Catalysts and Market Context
JASMY's ecosystem has seen strategic upgrades, including partnerships with Panasonic for IoT data platforms and the integration of Chainlink's CCIP for cross-chain interoperability [9]. These developments enhance the token's utility in enterprise IoT applications, potentially driving long-term demand. Additionally, the anticipated Federal Reserve rate cut in September 2025 could provide a macroeconomic tailwind for altcoins like JASMY [10].
Derivatives data further complicates the outlook: 52% of open positions are short, reflecting lingering bearish sentiment despite speculative buying pressure [11]. This duality suggests a market in flux, where technical buyers and on-chain skeptics are in a tug-of-war.
Key Levels to Watch
- Support: $0.00360–$0.00380 (critical wedge boundary), $0.0150 (Fibonacci 0.786).
- Resistance: $0.00500 (wedge upper boundary), $0.0194 (1.618 Fibonacci extension), $0.0243 (0.618 retracement).
A failure to hold above $0.0150 could invalidate the bullish wedge pattern, triggering a retest of $0.0100 [12]. Conversely, a breakout above $0.0200 may attract institutional buyers, particularly if ETF launches later in 2025 materialize [13].
Conclusion
JasmyCoin's price action presents a compelling case for both bulls and bears. While technical patterns like the falling wedge and inverse head-and-shoulders suggest a potential breakout, on-chain metrics such as declining large transactions and bearish NUPL trends highlight structural weaknesses. Investors should closely monitor key support/resistance levels and on-chain sentiment shifts, particularly as macroeconomic catalysts and ecosystem upgrades unfold. For now, JASMY remains a high-risk, high-reward asset, with its trajectory hinging on the resolution of this technical-on-chain tug-of-war.


Comentarios
Aún no hay comentarios