
IQVIA Shares Drop 3.23% Amid Bearish Technical Signals And High Volume Selling
Generado por agente de IAAinvest Technical Radar
martes, 17 de junio de 2025, 7:01 pm ET2 min de lectura
IQV--
Technical Analysis: IQVIAIQV-- (IQV)
Current Trading Data
IQVIA declined 3.23% in the latest session, closing at $154.10 with intraday volatility between $153.23 and $158.99. The session’s high volume (2.23M shares) signals conviction behind the bearish move.
Candlestick Theory
Recent candlesticks reveal bearish dominance. The June 17th session formed a long red candle closing near lows after a failed rally to $158.99, reinforcing resistance near $159. A dark cloud cover pattern emerged on June 10th–11th (green candle followed by a red candle opening above prior close and closing below midpoint), foreshadowing the current downtrend. Key support resides at $153.23 (June 17th low), while resistance solidifies at $159–$160, aligning with the June 16th rejection.
Moving Average Theory
The 50-day EMA (≈$159.50), 100-day EMA (≈$165.20), and 200-day EMA (≈$179.80) exhibit a bearish alignment, with all trending downward. The current price ($154.10) trades below all three averages, confirming a sustained downtrend. A recent death cross (50-day crossing below 100-day) amplifies bearish sentiment. Reclaiming the 50-day EMA is critical for trend reversal.
MACD & KDJ Indicators
MACD (12,26,9) shows a bearish crossover below the signal line, with the histogram deepening into negative territory. KDJ readings (K: 28, D: 42, J: 11) indicate oversold conditions (J-line at 11), though persistent downtrends can prolong such extremes. Divergence appears as price makes lower lows while KDJ’s J-line stabilizes—potentially flagging weakening momentum if sustained.
Bollinger Bands
Bands widened sharply during the June 17th sell-off, signaling elevated volatility. Price closed near the lower band ($153), suggesting oversold conditions but lacking immediate reversal signals. Contraction toward the middle band ($156) would indicate reduced volatility and possible consolidation. A close above $156 may signal stabilization.
Volume-Price Relationship
Volume surged 35% above average during the June 17th decline, validating bearish conviction. Down days since early June consistently featured higher volume than up days, confirming distribution. The absence of high-volume bullish reversals undermines recovery prospects.
Relative Strength Index (RSI)
RSI (14-day) sits at 39, hovering above oversold territory (<30) but trending downward. While not yet oversold, the swift decline from June 10th’s overbought peak (RSI: 71) reflects strong negative momentum. Bullish reversals require RSI stabilization above 45.
Fibonacci Retracement
Using the March 31st peak ($176.30) and the June 17th trough ($153.23):
- 61.8% retracement: $162.50 (strong resistance)
- 50% level: $164.80 (aligns with 100-day EMA resistance)
- 38.2% level: $167.10
The downtrend rejected prices near the 50% level multiple times in late May, reinforcing $162.50–$165 as a critical supply zone.
Confluence & Divergence Observations
- Confluence: Resistance at $159–$160 aligns with the 50-day EMA, psychological level, and prior support/resistance. Oversold KDJ and Bollinger Band proximity add weight to this barrier.
- Divergence: MACD’s bearish momentum contrasts with KDJ’s oversold signal, though the latter is typical in strong downtrends. RSI’s neutrality (39) tempers oversold interpretations.
Summary & Probabilistic Outlook
IQVIA faces entrenched bearish momentum, with technical structure favoring further downside toward $150–$152 support. Sustained trade below $153 may accelerate selling, while recovery requires reclaiming $156 (Bollinger mid-band) followed by $159–$160 resistance. High-volume capitulation could signal exhaustion, but until volume confirms accumulation, rallies likely remain corrective.
Note: Analysis based on provided historical data ending June 17, 2025. Real-time dynamics may alter probabilities.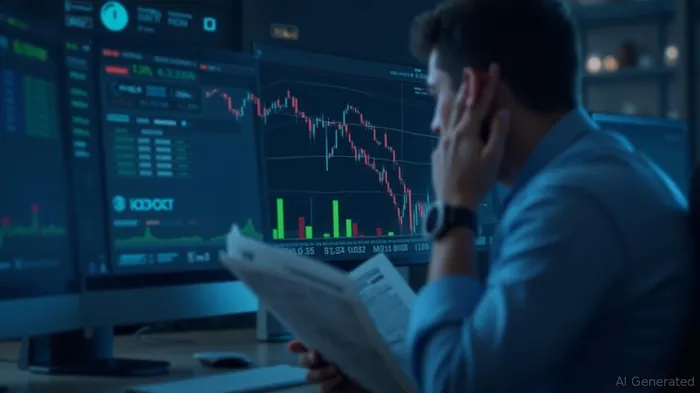
Divulgación editorial y transparencia de la IA: Ainvest News utiliza tecnología avanzada de Modelos de Lenguaje Largo (LLM) para sintetizar y analizar datos de mercado en tiempo real. Para garantizar los más altos estándares de integridad, cada artículo se somete a un riguroso proceso de verificación con participación humana.
Mientras la IA asiste en el procesamiento de datos y la redacción inicial, un miembro editorial profesional de Ainvest revisa, verifica y aprueba de forma independiente todo el contenido para garantizar su precisión y cumplimiento con los estándares editoriales de Ainvest Fintech Inc. Esta supervisión humana está diseñada para mitigar las alucinaciones de la IA y garantizar el contexto financiero.
Advertencia sobre inversiones: Este contenido se proporciona únicamente con fines informativos y no constituye asesoramiento profesional de inversión, legal o financiero. Los mercados conllevan riesgos inherentes. Se recomienda a los usuarios que realicen una investigación independiente o consulten a un asesor financiero certificado antes de tomar cualquier decisión. Ainvest Fintech Inc. se exime de toda responsabilidad por las acciones tomadas con base en esta información. ¿Encontró un error? Reportar un problema

SOBRE NOSOTROS
Nuestra historiaAutores de noticiasBase de conocimientosPolítica de privacidadTérmino de usoDescargo de responsabilidad de corretaje de tercerosTérminos de uso de AIMEDivulgaciones de riesgos de AInvest AICarrerasCONTÁCTENOS
Email: support@ainvest.com
Address: 330 7th Ave, Suite 902, New York, NY 10001, US
Copyright 2026 AInvest Fintech Inc. All rights reserved.
Comentarios
Aún no hay comentarios