
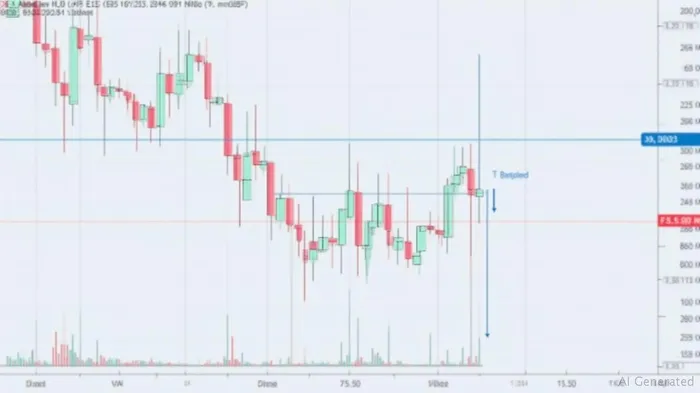
INNO HOLDINGS's 15min chart shows MACD & KDJ Death Cross signals.
PorAinvest
viernes, 30 de mayo de 2025, 9:30 am ET1 min de lectura
INHD--
The MACD Death Cross and KDJ Death Cross on May 29, 2025, suggest that Inno Holdings Inc. is likely to experience further downward pressure. This development is supported by the stock's recent performance, which has seen it fluctuate between $1.13 and $1.29 on May 30, 2025. The stock has also fallen in 7 out of the last 10 days, with a cumulative loss of -28.57% over this period [1].
The stock's downward trend is further supported by its short-term and long-term moving averages, which are signaling a sell. The stock also holds a sell signal from the 3-month Moving Average Convergence Divergence (MACD), indicating a bearish trend [1]. Additionally, the stock is oversold on the RSI14 (18), which may suggest further downward movement before a potential turnaround [1].
For the upcoming trading day on Monday, June 2, 2025, Inno Holdings Inc. is expected to open at $1.22, with a possible trading interval of +/-$0.96 (+/-76.64%) up or down from the last closing price. The stock's volatility, as indicated by its Bollinger Bands, is considered "very high risk," with a daily average volatility of 10.98% for the last week [1].
Given the bearish technical signals and the stock's recent performance, Inno Holdings Inc. is likely to continue its downward trend. Investors should exercise caution and closely monitor the stock's performance in the coming days and weeks.
References:
[1] https://stockinvest.us/stock/INHD
Based on INNO HOLDINGS's 15-minute chart, we observe a significant technical indicator. The MACD Death Cross and KDJ Death Cross occurred on May 29, 2025 at 16:00, suggesting that the stock price has the potential to decline further. This development implies a shift in momentum, with the stock price likely to continue its downward trend due to the bearish technical signals.
Inno Holdings Inc. (INHD) experienced a significant technical shift on May 29, 2025, at 16:00, as both the MACD and KDJ Death Cross occurred. This development suggests a bearish momentum shift, indicating that the stock price may continue its downward trend. The MACD Death Cross, a technical indicator that signals a potential reversal in the trend, occurred when the MACD line crosses below the signal line. Similarly, the KDJ Death Cross, an indicator that signals a potential trend reversal, occurred when the KDJ line crosses below the signal line.The MACD Death Cross and KDJ Death Cross on May 29, 2025, suggest that Inno Holdings Inc. is likely to experience further downward pressure. This development is supported by the stock's recent performance, which has seen it fluctuate between $1.13 and $1.29 on May 30, 2025. The stock has also fallen in 7 out of the last 10 days, with a cumulative loss of -28.57% over this period [1].
The stock's downward trend is further supported by its short-term and long-term moving averages, which are signaling a sell. The stock also holds a sell signal from the 3-month Moving Average Convergence Divergence (MACD), indicating a bearish trend [1]. Additionally, the stock is oversold on the RSI14 (18), which may suggest further downward movement before a potential turnaround [1].
For the upcoming trading day on Monday, June 2, 2025, Inno Holdings Inc. is expected to open at $1.22, with a possible trading interval of +/-$0.96 (+/-76.64%) up or down from the last closing price. The stock's volatility, as indicated by its Bollinger Bands, is considered "very high risk," with a daily average volatility of 10.98% for the last week [1].
Given the bearish technical signals and the stock's recent performance, Inno Holdings Inc. is likely to continue its downward trend. Investors should exercise caution and closely monitor the stock's performance in the coming days and weeks.
References:
[1] https://stockinvest.us/stock/INHD
Divulgación editorial y transparencia de la IA: Ainvest News utiliza tecnología avanzada de Modelos de Lenguaje Largo (LLM) para sintetizar y analizar datos de mercado en tiempo real. Para garantizar los más altos estándares de integridad, cada artículo se somete a un riguroso proceso de verificación con participación humana.
Mientras la IA asiste en el procesamiento de datos y la redacción inicial, un miembro editorial profesional de Ainvest revisa, verifica y aprueba de forma independiente todo el contenido para garantizar su precisión y cumplimiento con los estándares editoriales de Ainvest Fintech Inc. Esta supervisión humana está diseñada para mitigar las alucinaciones de la IA y garantizar el contexto financiero.
Advertencia sobre inversiones: Este contenido se proporciona únicamente con fines informativos y no constituye asesoramiento profesional de inversión, legal o financiero. Los mercados conllevan riesgos inherentes. Se recomienda a los usuarios que realicen una investigación independiente o consulten a un asesor financiero certificado antes de tomar cualquier decisión. Ainvest Fintech Inc. se exime de toda responsabilidad por las acciones tomadas con base en esta información. ¿Encontró un error? Reportar un problema

SOBRE NOSOTROS
Nuestra historiaAutores de noticiasBase de conocimientosPolítica de privacidadTérmino de usoDescargo de responsabilidad de corretaje de tercerosTérminos de uso de AIMEDivulgaciones de riesgos de AInvest AICarrerasCONTÁCTENOS
Email: support@ainvest.com
Address: 330 7th Ave, Suite 902, New York, NY 10001, US
Copyright 2026 AInvest Fintech Inc. All rights reserved.
Comentarios
Aún no hay comentarios