
INJ's Strategic Buy Zone and Potential for a Major Rebound: A Technical and On-Chain Analysis
Injective Protocol (INJ) has emerged as a compelling case study in the interplay between technical structure and on-chain sentiment. As the cryptocurrency navigates a critical juncture in its price trajectory, a strategic buy zone is forming around key support levels, supported by robust on-chain activity and improving market psychology. This analysis synthesizes technical indicators, whale behavior, and social sentiment to assess INJ's potential for a major rebound.
Technical Analysis: A Cautious Bull Case
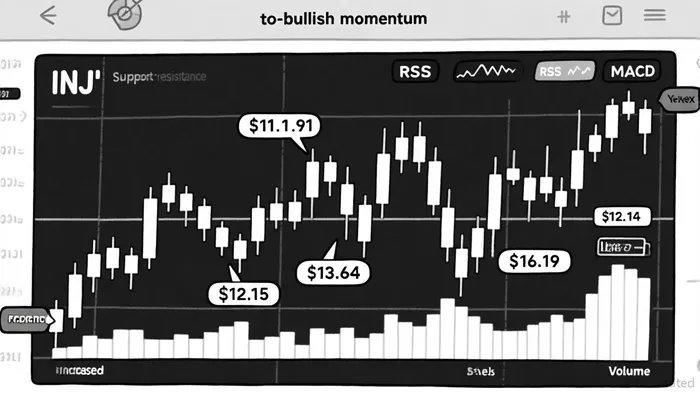
INJ's price action has consolidated within a defined range, with immediate support at $12.15 and $11.91, and resistance clustered at $13.64 and $16.19 [1]. The Relative Strength Index (RSI) currently resides in a neutral-to-oversold territory, suggesting the asset is poised for a rebound if buyers step in near support [3]. Meanwhile, the Moving Average Convergence Divergence (MACD) shows weakening bearish momentum, with the indicator hovering in a neutral range [5].
A breakout above $13.64 could trigger a 23% upside to $16.19, with further targets at $18.50–$20.00 if volume surges confirm the move [5]. Conversely, a breakdown below $12.15 risks testing $11.91 and potentially cascading to $10.50–$11.00 [5]. The 50-day and 200-day moving averages aligning with the current price level underscore a neutral trend, emphasizing the importance of volume confirmation for any directional bias [1].
On-Chain Catalysts: Adoption and Institutional Momentum
Injective's on-chain metrics tell a story of growing adoption. Daily active addresses (DAAs) surged 1,700% in 2025, reaching over 81,000 by July, driven by protocol upgrades like the Nivara Upgrade (February 2025) and the EVM Public Testnet (July 2025) [2]. These upgrades enhanced network performance and enabled Ethereum-compatible decentralized applications (dApps), broadening INJ's utility.
Whale activity also signals accumulation. Large investors have been observed moving holdings to cold wallets, a behavior historically associated with bullish price setups [3]. Additionally, the INJ 3.0 upgrade introduced a deflationary mechanism, with over 6.6 million tokens burned by July 2025, tightening supply and boosting investor confidence [1].
Social sentiment reinforces these fundamentals. While the Fear and Greed Index remains neutral at 49 [4], altindex.com reports a 100/100 sentiment score based on forum discussions, reflecting strong bullish conviction [3]. LunarCrush Analytics further notes a surge in social engagement, with INJINJ-- ranking second among AI-related cryptocurrencies [6].
Strategic Buy Zone: Balancing Risk and Reward
The confluence of technical and on-chain signals identifies $11.91–$12.15 as a strategic buy zone. This range offers downside protection via strong support levels while positioning investors to capitalize on a potential breakout above $13.64. Key catalysts for upward movement include:
1. Institutional adoption (e.g., BitGo's INJ integration).
2. Further RWA (Real-World Asset) tokenization advancements.
3. Validator network decentralization, with delegator numbers rising to 204,440 (32% of active addresses) [1].
However, risks persist. A breakdown below $11.91 could reignite bearish momentum, targeting $10.50–$11.00 [5]. Investors should monitor the NVT ratio (Network Value to Transactions) for valuation clues, though current data suggests a neutral-to-bullish setup [4].
Investment Outlook
INJ's technical structure and on-chain dynamics present a high-probability trade for risk-tolerant investors. With a projected 16.9% ROI by year-end and 27.2% by 2026 [3], the token's growth trajectory aligns with broader trends in decentralized finance (DeFi) and cross-chain interoperability.


Comentarios
Aún no hay comentarios