
Hyperliquid (HYPE): Is the Bear Flag Breakdown a Sell Signal or a Buying Opportunity?
The cryptocurrency market has long thrived on the tension between technical precision and sentiment-driven chaos. For Hyperliquid (HYPE), this tension is crystallizing in December 2025 as a bear flag pattern near $25 clashes with mixed on-chain and market sentiment signals. The question looms: Is the current breakdown a structural collapse or a temporary correction? To answer, we dissect the technical bear flag, juxtapose it with divergent sentiment metrics, and evaluate strategic entry/exit points amid looming catalysts.
Technical Bear Flag: A Continuation of Decline
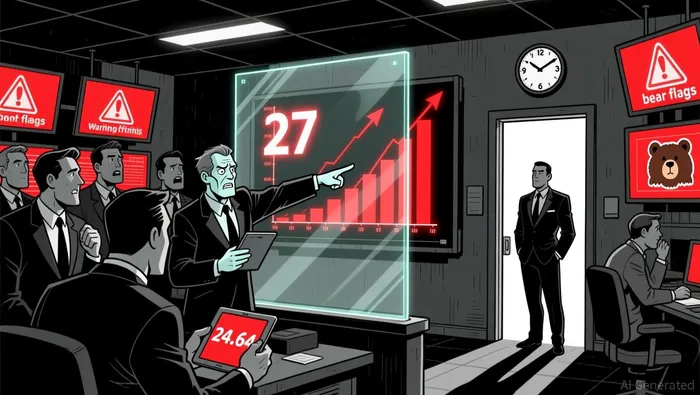
Hyperliquid's price action has formed a textbook bear flag pattern on the 12-hour chart, characterized by a sharp decline followed by consolidation within an upward channel. Key levels include resistance at $27 and support near $24.64. Analysts like Ali Martinez argue that a break below $24.64 could trigger a drop to $19, with the 9-period EMA lagging beneath the 21-period EMA and the MACD remaining in bearish territory (MACD line below signal line, negative histogram).
Volume analysis reinforces this bearish narrative. The liquidity area around $28 has been cleared, indicating sustained seller control. Meanwhile, the Grayscale ETF trust formation-a procedural step toward potential ETF filings-has yet to translate into immediate price support, as traders remain cautious. The bear flag's completion hinges on whether HYPE can hold above $24.64 before the February 2026 token unlock, which threatens to flood the market with 9.92 million tokens ($314 million in value).
Sentiment Divergence: Fear, Growth, and Structural Uncertainty
While technicals scream bearishness, sentiment metrics tell a more nuanced story. The Fear & Greed Index for HYPE plummeted to 16 (Extreme Fear) by December 19, 2025, reflecting widespread pessimism. However, this fear is not uniformly aligned with on-chain activity.
Hyperliquid's user base has exploded in 2025, growing from 300,000 to 1.4 million users-a 367% increase-driven by innovations like HyperEVM and Hypurr NFTs. Daily trading volume peaked at $32 billion, and TVL hit $6 billion. These metrics suggest structural adoption, yet they clash with declining 24-hour trading volume ($570 million as of December 2025, down 4.10% from prior days).
News-driven optimism further complicates the narrative. Bitwise's ETF filings and forecasts of M&A and institutional adoption in 2026 hint at long-term bullish potential. However, these positives are overshadowed by immediate headwinds: token unlocks, bearish price predictions (e.g., $19.31 by December 25, 2025), and a market share drop from 80% in May 2025 to 20% by December.
Structural vs. Temporary Breakdown: A Tale of Two Metrics
The bear flag's validity depends on whether the current selloff is structural (driven by fundamental weaknesses) or temporary (a correction within a broader bullish trend).
Structural Risks:
- Token Unlock Pressure: The February 2026 unlock introduces 9.92 million HYPE tokens, potentially overwhelming buyback efforts and depressing price.
- NVT Ratio Dynamics: While specific NVT values for December 2025 are unavailable, the platform's $2.95 trillion in 2025 transactions and $6 billion TVL suggest a healthy network, but declining trading volume raises questions about sustainability .
Temporary Factors:
- Fear-Driven Overselling: The Fear & Greed Index at 16 indicates extreme pessimism, often a contrarian indicator. History shows such levels can precede rebounds if fundamentals hold.
- Strategic Market Share Shifts: Hyperliquid's pivot to B2B infrastructure and reduced liquidity incentives may temporarily hurt market share but could strengthen long-term positioning.
Strategic Entry/Exit Points: Navigating the Divergence
For traders, the key lies in exploiting the divergence between technical bearishness and structural optimism.
- Bear Flag Breakdown as a Sell Signal:
- Exit Strategy: Traders holding HYPE should consider selling if the $24.64 support breaks, targeting $19 as a short-term floor.
Risk Mitigation: The February token unlock poses a critical risk; exiting before this event could preserve capital.
Buying Opportunity Amid Divergence:
- Entry Strategy: If HYPE retests the $25 support zone without breaking it, the bear flag pattern may fail, creating a buying opportunity. This scenario assumes the February unlock is absorbed by strong buyback programs or ETF-related demand.
- Sentiment Catalysts: A rebound in the Fear & Greed Index (e.g., above 50) or positive ETF news could trigger a short-term rally.
Conclusion: A High-Risk, High-Reward Dilemma
Hyperliquid's bear flag pattern and bearish technicals paint a grim short-term outlook, but the platform's user growth and long-term catalysts (ETFs, institutional adoption) suggest resilience. The divergence between fear-driven selling and structural adoption creates a high-risk, high-reward scenario. For risk-tolerant investors, a strategic entry near $25 could pay off if the bear flag fails. For others, the February token unlock serves as a clear exit signal. In the end, the market's verdict will hinge on whether Hyperliquid can convert its structural strengths into on-chain momentum before the next wave of selling pressure arrives.


Comentarios
Aún no hay comentarios