
D.R. Horton Stock Surges 3.85% to $133.88 as Technical Indicators Flash Bullish Signals
Generado por agente de IAAinvest Technical Radar
martes, 1 de julio de 2025, 6:47 pm ET2 min de lectura
DHI--
D.R. Horton (DHI) concluded the most recent session at $133.88, marking a notable gain of 3.85% and extending its winning streak to three consecutive days with a total advance of 5.29% over this period. This strong upward movement forms the basis for our technical assessment across multiple frameworks.
Candlestick Theory
Recent price action reveals a clear bullish trend characterized by successive green candles closing near their highs. The latest session formed a strong-bodied bullish candle, decisively breaching the prior swing high near $130.67 (from 2025-06-24), establishing it as new support. Key resistance now emerges around the psychological $140 level, a significant barrier tested unsuccessfully in late April and early May 2025. Support is reinforced near $128.01 (yesterday's low) and further strengthened around the convergence point with longer-term moving averages near $125.50.
Moving Average Theory
The short-term trajectory is decidedly positive. The price trades significantly above the 50-day Moving Average (MA), which slopes upward around $123.50. More crucially, the 50-day MA ($123.50) has recently executed a "golden cross" above the rising 200-day MA (~$122.80), a powerful long-term bullish signal confirming the primary uptrend initiated from the April 2025 low. The 100-day MA (~$124.00) also lies below the current price, providing additional layered support. This alignment across short (50-day), medium (100-day), and long-term (200-day) MAs strongly suggests sustained upward momentum.
MACD & KDJ Indicators
The Moving Average Convergence Divergence (MACD) supports the bullish bias, with its histogram printing increasingly positive bars and the signal line crossed above zero – indicating robust momentum within a bullish phase. The KDJ indicator, however, signals potential near-term exhaustion. Both the %K and %D lines reside in overbought territory (>80), suggesting the possibility of a minor pullback or consolidation soon, although it may persist in overbought conditions during strong rallies. The MACD's strength provides a counterbalance to KDJ's warning.
Bollinger Bands
Recent trading exhibits a classic volatility expansion pattern. The bands tightened significantly through late June (squeeze), reflecting reduced volatility and indecision. The powerful breakout rally witnessed over the last three sessions propelled the price from hugging the middle band to riding firmly against the upper band, confirming strong bullish momentum and signaling the successful resolution of the prior consolidation phase. Continued trading near the upper band underscores ongoing bullish pressure.
Volume-Price Relationship
The breakout is validated by supportive volume patterns. The initial surge on 2025-06-23 (+3.59%) occurred on notably high volume (~4.1M shares), exceeding the average, confirming buyer conviction. Sustained high volume over the subsequent days, culminating in yesterday's surge on the largest volume (~4.7M shares) of the recent data set, provides strong confirmation of the breakout's sustainability and accumulation occurring at higher prices. The volume profile enhances confidence in the strength of the current trend.
Relative Strength Index (RSI)
The 14-day RSI calculation yields a reading near 65, comfortably positioned within the neutral territory. This indicates DHI is neither overbought (>70) nor oversold (<30) currently. The RSI exhibits a healthy upward trajectory aligned with the price surge, reinforcing the positive momentum observed. Importantly, the current level leaves room for further price appreciation before entering the cautionary overbought zone.
Fibonacci Retracement
Applying Fibonacci retracement to the significant downward swing from the peak of $147.26 (2025-01-27) to the trough of $115.10 (2025-04-08) identifies key retracement levels. The recent price action is particularly compelling as it has decisively breached the critical 61.8% retracement level near $125.50. This breach now transforms $125.50 into robust support, coinciding remarkably well with the rising 200-day and 100-day MAs. The next significant Fibonacci resistance level lies at the 78.6% retracement near $133.80 (almost precisely the current close), followed by the critical full retracement (100%) level back at $147.26. Holding above $125.50 is crucial for maintaining the bullish bias targeting the $147 level.
Confluence and Divergence Summary
Strong confluence validates the current bullish outlook: the decisive break above the 61.8% Fibonacci retracement ($125.50) coupled with the golden cross formation (50DMA > 200DMA), bullish MACD positioning, breakout confirmation from a Bollinger Band squeeze on rising volume, and neutral RSI allowing upside room all align positively. The primary caveat lies with the overbought KDJ reading, suggesting potential for near-term consolidation or pullback despite the strong trend. A key divergence emerges as the price makes higher highs, but the MACD histogram currently shows a marginally lower high compared to the peak earlier in June; this warrants monitoring, as a failure to achieve new highs on the MACD alongside price could signal waning momentum, though this divergence is currently minor. Overall, the technical structure for D.R. Horton remains robustly bullish.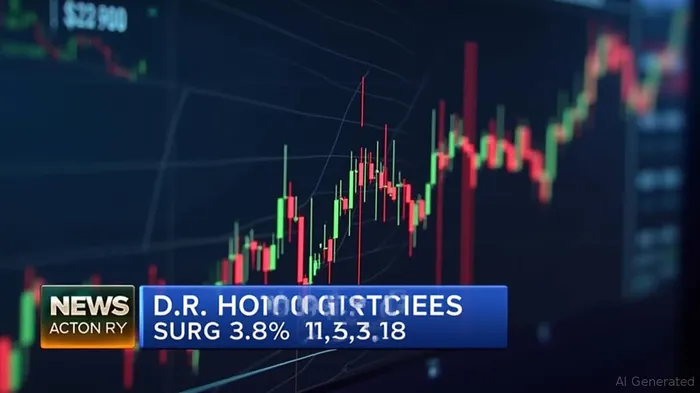
Divulgación editorial y transparencia de la IA: Ainvest News utiliza tecnología avanzada de Modelos de Lenguaje Largo (LLM) para sintetizar y analizar datos de mercado en tiempo real. Para garantizar los más altos estándares de integridad, cada artículo se somete a un riguroso proceso de verificación con participación humana.
Mientras la IA asiste en el procesamiento de datos y la redacción inicial, un miembro editorial profesional de Ainvest revisa, verifica y aprueba de forma independiente todo el contenido para garantizar su precisión y cumplimiento con los estándares editoriales de Ainvest Fintech Inc. Esta supervisión humana está diseñada para mitigar las alucinaciones de la IA y garantizar el contexto financiero.
Advertencia sobre inversiones: Este contenido se proporciona únicamente con fines informativos y no constituye asesoramiento profesional de inversión, legal o financiero. Los mercados conllevan riesgos inherentes. Se recomienda a los usuarios que realicen una investigación independiente o consulten a un asesor financiero certificado antes de tomar cualquier decisión. Ainvest Fintech Inc. se exime de toda responsabilidad por las acciones tomadas con base en esta información. ¿Encontró un error? Reportar un problema

SOBRE NOSOTROS
Nuestra historiaAutores de noticiasBase de conocimientosPolítica de privacidadTérmino de usoDescargo de responsabilidad de corretaje de tercerosTérminos de uso de AIMEDivulgaciones de riesgos de AInvest AICarrerasCONTÁCTENOS
Email: support@ainvest.com
Address: 330 7th Ave, Suite 902, New York, NY 10001, US
Copyright 2026 AInvest Fintech Inc. All rights reserved.
Comentarios
Aún no hay comentarios