
Hedera HBAR Price Forecast: Bullish Pattern Suggests Possible Breakout
PorAinvest
viernes, 29 de agosto de 2025, 1:10 pm ET1 min de lectura
HBAR--
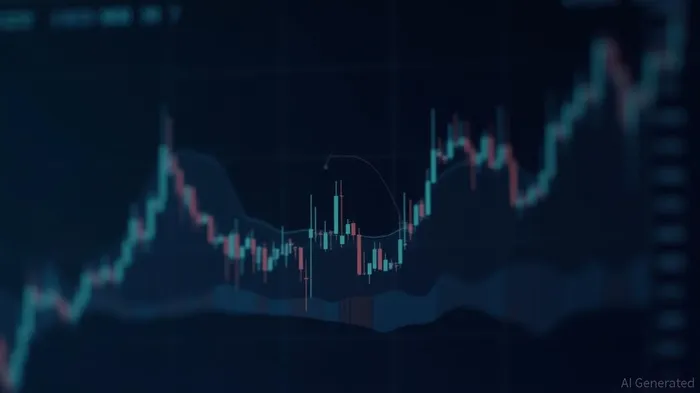
Bull Flag Formation
The bull flag formation is a technical chart pattern that indicates a potential breakout. It consists of a flagpole, which is a downtrend, followed by a flag, which is a consolidation period. The current price action suggests that HBAR is forming a bull flag, with the flagpole being the recent downtrend and the flag being the consolidation period. A breakout above the upper resistance level of the flag could signal a significant uptrend.
Golden Cross and Diminishing Selling Pressure
Momentum indicators such as the Moving Average Convergence Divergence (MACD) and Relative Strength Index (RSI) are showing a Golden Cross. This occurs when the MACD line crosses above the signal line, indicating a potential bullish trend. Additionally, diminishing selling pressure is evident, as the price has been consolidating and showing signs of a breakout.
Elliott Wave Structure
The Elliott Wave Principle suggests that the market moves in waves. Analysts have identified an Elliott Wave structure in HBAR's price action, which could indicate a powerful rally. The current wave is the corrective wave, and a breakout from the bull flag could signal the start of the next impulsive wave.
Conclusion
Hedera (HBAR) is showing signs of a bullish trend with a bull flag formation, Golden Cross, diminishing selling pressure, and an Elliott Wave structure. Analysts are optimistic about the potential for a significant price increase, with initial breakouts targeting $0.40 and medium-term targets at $0.55. However, it is essential to note that the cryptocurrency market is highly volatile, and prices can fluctuate significantly. Investors should conduct thorough research and consider their risk tolerance before making investment decisions.
References
[1] https://stealthex.io/blog/hedera-hashgraph-hbar-price-prediction/
Hedera (HBAR) is trading near $0.229, down 4% in 24 hours, but has gained 340% in the past year. Analysts note a bull flag formation with a possible breakout to $0.40 initially and $0.55 in the medium term. Momentum indicators show a Golden Cross and diminishing selling pressure, supporting a bullish case. Analysts also point to an Elliott Wave structure that could fuel a powerful rally.
Hedera (HBAR) is trading near $0.229, down 4% in the last 24 hours, but has gained 340% in the past year. Analysts have identified a bull flag formation with a possible breakout to $0.40 initially and $0.55 in the medium term. Momentum indicators show a Golden Cross and diminishing selling pressure, supporting a bullish case. Additionally, an Elliott Wave structure could fuel a powerful rally.Bull Flag Formation
The bull flag formation is a technical chart pattern that indicates a potential breakout. It consists of a flagpole, which is a downtrend, followed by a flag, which is a consolidation period. The current price action suggests that HBAR is forming a bull flag, with the flagpole being the recent downtrend and the flag being the consolidation period. A breakout above the upper resistance level of the flag could signal a significant uptrend.
Golden Cross and Diminishing Selling Pressure
Momentum indicators such as the Moving Average Convergence Divergence (MACD) and Relative Strength Index (RSI) are showing a Golden Cross. This occurs when the MACD line crosses above the signal line, indicating a potential bullish trend. Additionally, diminishing selling pressure is evident, as the price has been consolidating and showing signs of a breakout.
Elliott Wave Structure
The Elliott Wave Principle suggests that the market moves in waves. Analysts have identified an Elliott Wave structure in HBAR's price action, which could indicate a powerful rally. The current wave is the corrective wave, and a breakout from the bull flag could signal the start of the next impulsive wave.
Conclusion
Hedera (HBAR) is showing signs of a bullish trend with a bull flag formation, Golden Cross, diminishing selling pressure, and an Elliott Wave structure. Analysts are optimistic about the potential for a significant price increase, with initial breakouts targeting $0.40 and medium-term targets at $0.55. However, it is essential to note that the cryptocurrency market is highly volatile, and prices can fluctuate significantly. Investors should conduct thorough research and consider their risk tolerance before making investment decisions.
References
[1] https://stealthex.io/blog/hedera-hashgraph-hbar-price-prediction/

Divulgación editorial y transparencia de la IA: Ainvest News utiliza tecnología avanzada de Modelos de Lenguaje Largo (LLM) para sintetizar y analizar datos de mercado en tiempo real. Para garantizar los más altos estándares de integridad, cada artículo se somete a un riguroso proceso de verificación con participación humana.
Mientras la IA asiste en el procesamiento de datos y la redacción inicial, un miembro editorial profesional de Ainvest revisa, verifica y aprueba de forma independiente todo el contenido para garantizar su precisión y cumplimiento con los estándares editoriales de Ainvest Fintech Inc. Esta supervisión humana está diseñada para mitigar las alucinaciones de la IA y garantizar el contexto financiero.
Advertencia sobre inversiones: Este contenido se proporciona únicamente con fines informativos y no constituye asesoramiento profesional de inversión, legal o financiero. Los mercados conllevan riesgos inherentes. Se recomienda a los usuarios que realicen una investigación independiente o consulten a un asesor financiero certificado antes de tomar cualquier decisión. Ainvest Fintech Inc. se exime de toda responsabilidad por las acciones tomadas con base en esta información. ¿Encontró un error? Reportar un problema

SOBRE NOSOTROS
Nuestra historiaAutores de noticiasBase de conocimientosPolítica de privacidadTérmino de usoDescargo de responsabilidad de corretaje de tercerosTérminos de uso de AIMEDivulgaciones de riesgos de AInvest AICarrerasCONTÁCTENOS
Email: support@ainvest.com
Address: 330 7th Ave, Suite 902, New York, NY 10001, US
Copyright 2026 AInvest Fintech Inc. All rights reserved.
Comentarios
Aún no hay comentarios