
HBAR Token's 15% Plunge: Bearish Momentum and On-Chain Signals Point to Deeper Declines
The native token of HederaHBAR-- (HBAR) has plunged 15% over the past week, hitting a two-month low of $0.2077 as bearish sentiment intensifies across derivatives and spot markets[1]. This sharp decline, driven by a combination of technical breakdowns, reduced open interest, and on-chain outflows, raises critical questions about the token's near-term trajectory.
Technical Deterioration and Liquidity Concerns
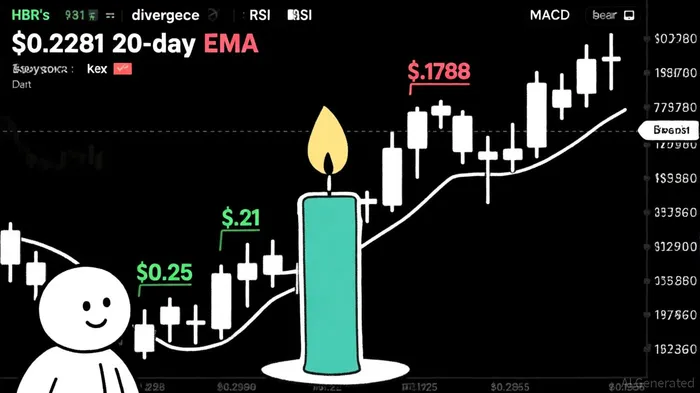
HBAR's breakdown below its 20-day EMA at $0.2281 has confirmed a shift in momentum, with the 20-day EMA now acting as dynamic resistance[1]. Traders are now bracing for a test of the $0.1788 support level, a threshold that, if breached, could trigger algorithmic selling toward $0.195[3]. Derivatives data exacerbates the bearish outlook: open interest has fallen 26% since September 13, signaling reduced capital inflows and increased position closures[1]. This liquidity contraction heightens volatility risks, as even modest selling pressure could accelerate further declines.
The long/short ratio of 0.86 underscores the imbalance in market positioning, with short sellers now outnumbering longs[1]. Such a ratio typically precedes extended bearish phases, as short positions gain leverage during downward spirals. Meanwhile, a recovery above $0.2212—a level tied to the 20-day SMA—would require significant capital inflow to rekindle bullish momentum[1], a scenario that appears unlikely given current market dynamics.
Overlay technical indicators like RSI and MACD show bearish divergence[1], suggesting weakening momentum despite price highs. A backtest of this pattern—selling HBARHBAR-- on MACD Top Divergence and holding for 30 trading days—reveals no historical instances of such signals since 2022[4]. This absence aligns with HBAR's prolonged bearish trend, where range-bound or declining price action has limited classic higher-high structures.
On-Chain Sentiment: Mixed Signals Amid Outflows
On-chain activity in September 2025 reveals a fractured narrative. While HBAR's transaction volumes surged 7% in late September, pushing the token toward key resistance levels[2], broader metrics tell a different story. The token's high correlation with BitcoinBTC-- (0.92) has amplified its decline as BTC's bearish trend dragged HBAR lower[5]. Additionally, stablecoin market cap on the Hedera networkHBAR-- has dropped 53%, signaling reduced liquidity for real-world asset applications[4].
Whale activity offers a glimmer of optimism, with large account holders accumulating HBAR despite retail outflows[3]. However, this institutional interest contrasts sharply with retail traders' exodus, creating a tug-of-war that could prolong consolidation. The NVT (Network Value to Transactions) ratio, though not explicitly quantified in recent reports, appears to reflect undervaluation relative to transaction growth[2]. If HBAR's utility continues to outpace its market cap, the NVT could normalize, but this would require sustained price stability—a scenario currently at odds with the token's volatility.
Broader Market Context: A Critical Juncture
HBAR's price trajectory is now hinged on its ability to defend key psychological levels. Analysts project a short-term decline to $0.15 if the $0.21 support fails[2], while a rebound above $0.25 could initiate a 4-6 week rally toward $0.28[1]. However, the token's historical weakness in September—averaging 10% declines—adds a layer of skepticism to bullish forecasts[5].
Enterprise partnerships, including supply chain tracking and carbon credit validation, remain a foundational narrative[1]. Yet, these developments have yet to translate into robust on-chain adoption. The network's capacity to handle 10,000 transactions per second[5] is a technical strength, but without a corresponding rise in active addresses, this capability remains underutilized.
Conclusion: A Bearish Bias Prevails
HBAR's technical and on-chain fundamentals paint a cautiously bearish picture. The confluence of declining open interest, bearish momentum indicators, and a fragile support structure suggests further downside is likely in the near term. While institutional accumulation and enterprise adoption offer long-term hope, these factors are unlikely to offset immediate selling pressure. Investors should closely monitor the $0.21 support level, as its integrity will determine whether HBAR enters a deeper correction or initiates a short-lived rebound.


Comentarios
Aún no hay comentarios