
HBAR's Critical $0.146 Support and Path to $0.17–$0.19: A Technical Deep Dive
Technical Reversal Signals: Divergence and Institutional Clues
HBAR has been testing the $0.146 support level with increasing urgency. Over the past three months, the token has plummeted nearly 39%, creating a high-stakes scenario where a small pullback could either trigger further selling or sparkSPK-- a rebound. The Relative Strength Index (RSI) has formed a hidden bearish divergence on the 12-hour chart: while the RSI created a higher low, the price made a lower low. This divergence suggests weakening bearish momentum, but caution is warranted, as MACD and moving averages remain bearish.
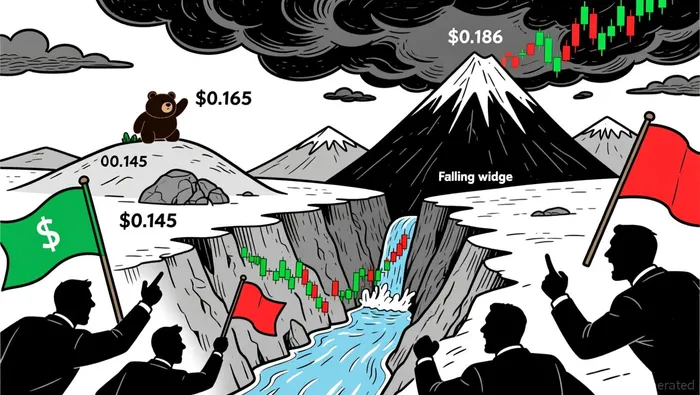 Meanwhile, the falling wedge pattern on the daily chart adds nuance. For bulls to retain control, HBARHBAR-- must hold above $0.145 according to technical analysis. A close below this level would invalidate the pattern and expose downside targets. However, recent on-chain data offers a glimmer of hope: the Chaikin Money Flow (CMF) indicator has turned upward, signaling potential institutional accumulation. This contrasts with previous failed rallies, where volume and flow metrics lacked conviction.
Volume Metrics and the Road to $0.17–$0.19
Volume confirmation is a linchpin for any sustainable rebound. While HBAR's current price action at $0.146 remains fragile, technical analysts note that a successful hold could catalyze a move toward $0.17–$0.19. This range represents a key psychological barrier and a potential inflection point for short-term traders.
The path to $0.17–$0.19 hinges on two factors:
1. RSI divergence resolution: If the bearish divergence on the 12-hour chart resolves into a bullish reversal (e.g., a higher high in RSI with a corresponding price rebound), it could attract dip buyers.
2. Institutional validation: Rising CMF and increased volume suggest that large players are accumulating HBAR at discounted levels. This contrasts with retail-driven bounces, which often lack follow-through.
Strategic Entry Timing: Risk vs. Reward
For investors considering an entry, timing is everything. A break above $0.165 would signal renewed bullish momentum, with $0.186 acting as the next critical resistance level. If HBAR clears these hurdles, the trajectory toward $0.219 becomes more plausible. However, the risks are non-trivial: a breakdown below $0.145 would likely accelerate selling into weakness, targeting $0.12–$0.13.
A disciplined approach would involve:
- Buying on strength: Entering near $0.146–$0.148 if volume spikes and CMF confirms accumulation.
- Scaling in: Adding positions incrementally as HBAR reclaims $0.165 and $0.186.
- Stop-loss placement: Setting stops below $0.145 to mitigate downside risk.
Conclusion: A High-Stakes Technical Crossroads
HBAR's $0.146 support level is more than a price-it's a battleground between bulls and bears. While RSI divergence and CMF suggest that selling pressure is waning, the bearish bias in broader momentum indicators means this is far from a guaranteed trade. For altcoin investors, the key takeaway is clear: HBAR's next move will be defined by institutional follow-through and volume validation. Those who can navigate this volatility with precision may find themselves positioned for a meaningful rebound-or exposed to a sharp correction.


Comentarios
Aún no hay comentarios