
Global Equity Markets at a Crossroads: Overvaluation Risks and Historical Parallels
The global equity market is at a critical juncture, with valuation metrics flashing warning signals reminiscent of past speculative excesses. As of June 2025, the U.S. Buffett Indicator-a measure of market capitalization relative to GDP-stands at 217%, according to the Buffett Indicator valuation model, a level approximately 2.2 standard deviations above the historical trend line. This stark overvaluation echoes the peaks seen in 1999 (CAPE 44.2) and 2007 (CAPE 27.3), both of which were followed by prolonged periods of subpar or negative returns, as discussed in a century of valuation history.
A Century of Valuation Cycles
The S&P 500's CAPE ratio of 38.0 in August 2025, according to that analysis, underscores the gravity of the situation. This metric, which smooths earnings over a 10-year period to account for economic cycles, has historically signaled impending corrections when elevated. For instance, the dot-com bubble's CAPE of 44.2 presaged a decade of –4.7% annualized real returns, while the 2007 peak of 27.3 was followed by a 57% nominal decline before recovery, as the same analysis documents. By comparison, the current CAPE of 38.0 sits perilously close to the 1999 threshold, suggesting a similar reckoning may loom.
The disparity in valuations across regions further complicates the landscape. While U.S. markets trade at premium multiples, emerging markets and parts of Europe offer more attractive entry points. The MSCI Emerging Markets index, for example, sports a CAPE of 16, and Germany's DAX trades at 24.3, reflecting a global dispersion that has widened in recent years. This divergence raises questions about the sustainability of capital flows into overvalued developed markets and the potential for a rotation toward undervalued regions.
Narrowing Risk Premiums and Safe-Haven Demand
The equity risk premium (ERP)-the spread between real equity returns and inflation-adjusted bond yields-has contracted to historically low levels in the U.S., currently below 450 basis points. Historically, such compression has correlated with diminished real returns over the following decade, as investors demand less compensation for bearing equity risk. Meanwhile, gold prices have surged to $3,361 per ounce, a level not seen since the 1980s. This surge in safe-haven demand, even with positive real yields on Treasuries, signals growing uncertainty about the durability of current market conditions.
Implications for Investors
For investors, the historical record offers a sobering lesson: markets that appear invincible in hindsight often deliver painful outcomes for those unprepared. The current confluence of elevated Buffett and CAPE ratios, compressed risk premiums, and rising safe-haven demand suggests a heightened probability of mean reversion. While short-term momentum may persist, the long-term outlook for equities-particularly in overvalued developed markets-appears clouded.
Strategically, investors may want to prioritize defensive positioning, tilt toward undervalued regions like emerging markets, and hedge against volatility through diversified portfolios. As the adage goes, "Bull markets rise on hope, bear markets fall on fear"-but history shows that overvaluation metrics are not merely academic curiosities; they are the canaries in the coal mine.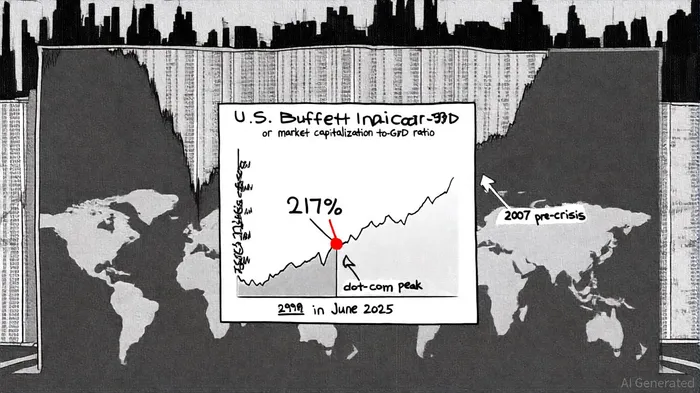


Comentarios
Aún no hay comentarios