
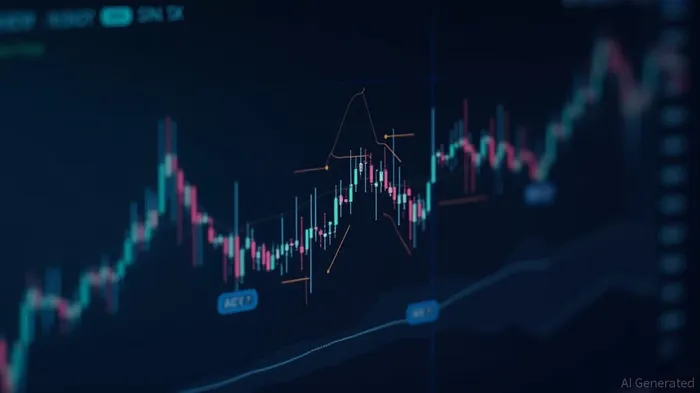
Genpact's 15min chart sees KDJ Death Cross, Bearish Marubozu pattern.
PorAinvest
lunes, 28 de julio de 2025, 3:33 pm ET1 min de lectura
G--
The RSI, a momentum indicator, measures the speed and change of price movements. When the RSI is above 70, the stock is considered overbought, indicating a potential correction. Genpact's RSI value stands at 76.1, placing it in overbought territory [1]. The KDJ indicator, or Stochastic Oscillator, compares a stock's price to its price range over a certain period. The death cross, where the %K line crosses below the %D line, suggests a potential trend reversal. The formation of a death cross at 15:30 on July 28, 2025, adds weight to the indication of a downward trend in Genpact's stock price [1].
The Bearish Marubozu, a candlestick pattern, is characterized by a large body with no upper or lower shadows, indicating strong selling pressure. The formation of this pattern at 15:30 on July 28, 2025, confirms the bearish momentum observed in the KDJ Death Cross and RSI levels.
Investors should be cautious about the potential for further price decline, as both the RSI and KDJ indicators suggest a shift in momentum towards the downside. However, it is essential to consider that technical indicators alone may not provide a complete picture of a stock's performance. Fundamental analysis, including earnings reports and revenue growth, should also be considered when making investment decisions.
References:
[1] https://www.ainvest.com/news/genpact-15min-chart-shows-rsi-overbought-kdj-death-cross-2507-36/
Genpact's 15-minute chart has triggered a KDJ Death Cross and a Bearish Marubozu, which occurred at 07/28/2025 at 15:30. This indicates a shift in momentum towards the downside, with a potential for further price decrease. Sellers are currently in control of the market, and it is likely that this bearish momentum will continue.
Genpact Limited (NYSE: G) has experienced a significant shift in its stock price momentum, as indicated by the formation of a KDJ Death Cross and a Bearish Marubozu on its 15-minute chart. This occurred on July 28, 2025, at 15:30, signaling a potential downward trend for the stock. The Relative Strength Index (RSI) and KDJ indicator suggest that the stock's rapid ascent may be unsustainable, and that sellers are currently in control of the market.The RSI, a momentum indicator, measures the speed and change of price movements. When the RSI is above 70, the stock is considered overbought, indicating a potential correction. Genpact's RSI value stands at 76.1, placing it in overbought territory [1]. The KDJ indicator, or Stochastic Oscillator, compares a stock's price to its price range over a certain period. The death cross, where the %K line crosses below the %D line, suggests a potential trend reversal. The formation of a death cross at 15:30 on July 28, 2025, adds weight to the indication of a downward trend in Genpact's stock price [1].
The Bearish Marubozu, a candlestick pattern, is characterized by a large body with no upper or lower shadows, indicating strong selling pressure. The formation of this pattern at 15:30 on July 28, 2025, confirms the bearish momentum observed in the KDJ Death Cross and RSI levels.
Investors should be cautious about the potential for further price decline, as both the RSI and KDJ indicators suggest a shift in momentum towards the downside. However, it is essential to consider that technical indicators alone may not provide a complete picture of a stock's performance. Fundamental analysis, including earnings reports and revenue growth, should also be considered when making investment decisions.
References:
[1] https://www.ainvest.com/news/genpact-15min-chart-shows-rsi-overbought-kdj-death-cross-2507-36/
Divulgación editorial y transparencia de la IA: Ainvest News utiliza tecnología avanzada de Modelos de Lenguaje Largo (LLM) para sintetizar y analizar datos de mercado en tiempo real. Para garantizar los más altos estándares de integridad, cada artículo se somete a un riguroso proceso de verificación con participación humana.
Mientras la IA asiste en el procesamiento de datos y la redacción inicial, un miembro editorial profesional de Ainvest revisa, verifica y aprueba de forma independiente todo el contenido para garantizar su precisión y cumplimiento con los estándares editoriales de Ainvest Fintech Inc. Esta supervisión humana está diseñada para mitigar las alucinaciones de la IA y garantizar el contexto financiero.
Advertencia sobre inversiones: Este contenido se proporciona únicamente con fines informativos y no constituye asesoramiento profesional de inversión, legal o financiero. Los mercados conllevan riesgos inherentes. Se recomienda a los usuarios que realicen una investigación independiente o consulten a un asesor financiero certificado antes de tomar cualquier decisión. Ainvest Fintech Inc. se exime de toda responsabilidad por las acciones tomadas con base en esta información. ¿Encontró un error? Reportar un problema

SOBRE NOSOTROS
Nuestra historiaAutores de noticiasBase de conocimientosPolítica de privacidadTérmino de usoDescargo de responsabilidad de corretaje de tercerosTérminos de uso de AIMEDivulgaciones de riesgos de AInvest AICarrerasCONTÁCTENOS
Email: support@ainvest.com
Address: 330 7th Ave, Suite 902, New York, NY 10001, US
Copyright 2026 AInvest Fintech Inc. All rights reserved.
Comentarios
Aún no hay comentarios