
Franklin Electric 15-Min Chart Shows Downward Expanding Bollinger, Bearish Marubozu
PorAinvest
viernes, 30 de agosto de 2024, 12:36 pm ET1 min de lectura
FELE--
Bollinger Bands, a popular technical analysis tool [2], provide insight into a security's volatility by measuring its standard deviation from the moving average. An expansion of these bands indicates increased price volatility, which can be attributed to heightened uncertainty or increased risk aversion in the market. In FELE's case, the downward expansion of the Bollinger Bands suggests that sellers have been exerting significant control over the market [1].
The Bearish Marubozu candlestick pattern, formed when a security's price opens at a high, closes at a low, and remains below its opening price throughout the period [2], is a bearish reversal signal. Its presence in FELE's 15-minute chart suggests that selling pressure is dominating the market. This could be a continuation of the bearish trend that has been in effect since the beginning of August [1].
Other companies, such as MillerKnoll (MLKN) and Pulse Biosciences (PULS), have also exhibited similar patterns [1][2]. Their 15-minute charts have shown expansions of their Bollinger Bands and the formation of Bearish Marubozu candlestick patterns, indicating that selling pressure is dominating the market.
Investors should exercise caution when considering FELE's stock as part of their investment portfolios. The persisting bearish trend, signaled by the expansion of Bollinger Bands and the formation of a Bearish Marubozu candlestick pattern, could potentially lead to further declines in FELE's stock price.
Sources:
[1] A Invest. (2024, August 30). Eastern's 15-Min Chart Signals Bearish Marubozu Bollinger Bands Expansion. Retrieved from https://www.ainvest.com/news/eastern-s-15-min-chart-signals-bearish-marubozu-bollinger-bands-expansion-240810007fe4ca8e64a68155/
[2] Investopedia. (n.d.). Bollinger Bands. Retrieved from https://www.investopedia.com/terms/b/bollingerbands.asp
MLKN--
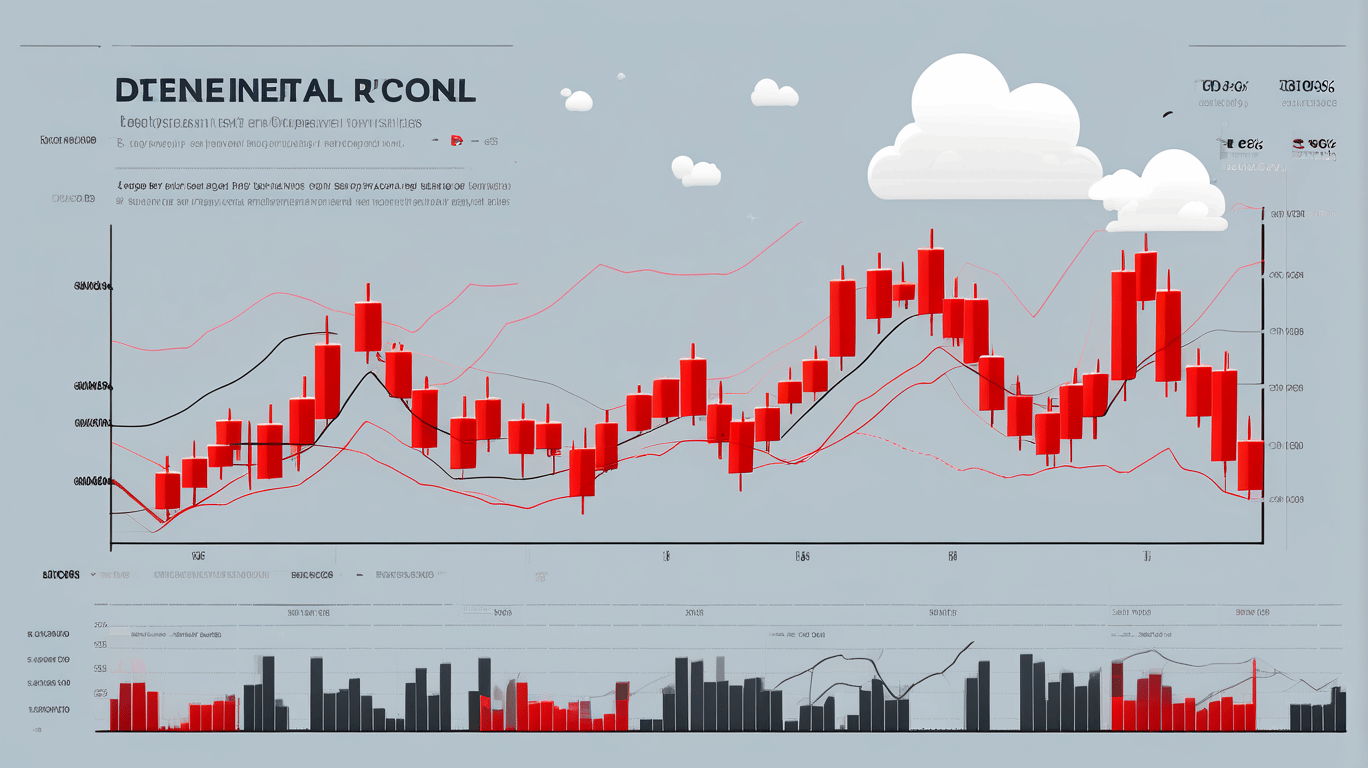
The 15-minute chart for Franklin Electric has indicated an expansion of the Bollinger Bands in a downward direction as of 12:30 PM on August 30, 2024. Additionally, the presence of a Bearish Marubozu candlestick pattern suggests that the market is being dominated by sellers, who are exerting significant control over the trading dynamics. This pattern of bearish momentum is expected to persist in the near term.
Franklin Electric (FELE) [1], a leading global provider of solutions for water and air systems, has seen its 15-minute chart indicate a potential continuation of the bearish trend. As of August 30, 2024, at 12:30 PM, the Bollinger Bands have expanded downward, and a Bearish Marubozu candlestick pattern has emerged [1].Bollinger Bands, a popular technical analysis tool [2], provide insight into a security's volatility by measuring its standard deviation from the moving average. An expansion of these bands indicates increased price volatility, which can be attributed to heightened uncertainty or increased risk aversion in the market. In FELE's case, the downward expansion of the Bollinger Bands suggests that sellers have been exerting significant control over the market [1].
The Bearish Marubozu candlestick pattern, formed when a security's price opens at a high, closes at a low, and remains below its opening price throughout the period [2], is a bearish reversal signal. Its presence in FELE's 15-minute chart suggests that selling pressure is dominating the market. This could be a continuation of the bearish trend that has been in effect since the beginning of August [1].
Other companies, such as MillerKnoll (MLKN) and Pulse Biosciences (PULS), have also exhibited similar patterns [1][2]. Their 15-minute charts have shown expansions of their Bollinger Bands and the formation of Bearish Marubozu candlestick patterns, indicating that selling pressure is dominating the market.
Investors should exercise caution when considering FELE's stock as part of their investment portfolios. The persisting bearish trend, signaled by the expansion of Bollinger Bands and the formation of a Bearish Marubozu candlestick pattern, could potentially lead to further declines in FELE's stock price.
Sources:
[1] A Invest. (2024, August 30). Eastern's 15-Min Chart Signals Bearish Marubozu Bollinger Bands Expansion. Retrieved from https://www.ainvest.com/news/eastern-s-15-min-chart-signals-bearish-marubozu-bollinger-bands-expansion-240810007fe4ca8e64a68155/
[2] Investopedia. (n.d.). Bollinger Bands. Retrieved from https://www.investopedia.com/terms/b/bollingerbands.asp
Divulgación editorial y transparencia de la IA: Ainvest News utiliza tecnología avanzada de Modelos de Lenguaje Largo (LLM) para sintetizar y analizar datos de mercado en tiempo real. Para garantizar los más altos estándares de integridad, cada artículo se somete a un riguroso proceso de verificación con participación humana.
Mientras la IA asiste en el procesamiento de datos y la redacción inicial, un miembro editorial profesional de Ainvest revisa, verifica y aprueba de forma independiente todo el contenido para garantizar su precisión y cumplimiento con los estándares editoriales de Ainvest Fintech Inc. Esta supervisión humana está diseñada para mitigar las alucinaciones de la IA y garantizar el contexto financiero.
Advertencia sobre inversiones: Este contenido se proporciona únicamente con fines informativos y no constituye asesoramiento profesional de inversión, legal o financiero. Los mercados conllevan riesgos inherentes. Se recomienda a los usuarios que realicen una investigación independiente o consulten a un asesor financiero certificado antes de tomar cualquier decisión. Ainvest Fintech Inc. se exime de toda responsabilidad por las acciones tomadas con base en esta información. ¿Encontró un error? Reportar un problema

SOBRE NOSOTROS
Nuestra historiaAutores de noticiasBase de conocimientosPolítica de privacidadTérmino de usoDescargo de responsabilidad de corretaje de tercerosTérminos de uso de AIMEDivulgaciones de riesgos de AInvest AICarrerasCONTÁCTENOS
Email: support@ainvest.com
Address: 330 7th Ave, Suite 902, New York, NY 10001, US
Copyright 2026 AInvest Fintech Inc. All rights reserved.
Comentarios
Aún no hay comentarios