
FET at a Pivotal Technical Inflection Point
The Symmetrical Triangle: A Framework for Breakout Analysis
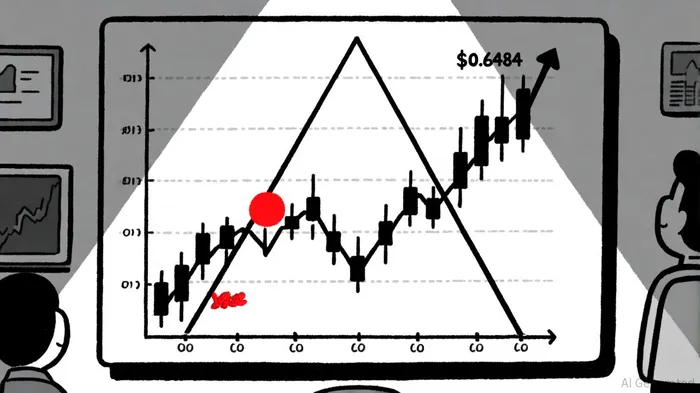
A symmetrical triangle is formed by two converging trend lines connecting sequentially lower highs and higher lows. This pattern reflects a temporary stalemate in market sentiment, with neither buyers nor sellers gaining the upper hand. According to a StockCharts report, such patterns typically resolve in the direction of the prevailing trend 75% of the time, though the actual breakout direction remains uncertain until confirmed. For FET, the price has been oscillating within this structure, currently hovering near $0.6484 at the apex of the triangle, as noted in the TronWeekly analysis.
The validity of a breakout is confirmed when the price closes decisively outside the triangle's boundaries, accompanied by a surge in trading volume. Once confirmed, the potential price target can be estimated by measuring the triangle's widest width and projecting that distance from the breakout point, as explained in Investopedia's guide. For FET, this could imply a target of $1.60 if the pattern resolves in a bullish direction, according to the TronWeekly analysis.
Volume Trends and Market Sentiment
The recent surge in FET's trading volume, despite a weak price trend, highlights the uncertainty surrounding its short-term outlook. As Investopedia notes, increased volume during pattern formation often signals a buildup of conviction among traders, even if the price remains range-bound. This dynamic suggests that market participants are actively positioning for a breakout, with the token's volatility likely to intensify as the apex is approached.
However, the absence of a clear trend prior to the triangle's formation complicates the interpretation of its resolution. Unlike ascending or descending triangles, which often align with bullish or bearish biases, symmetrical triangles are neutral. This neutrality means FET's breakout could theoretically favor either direction, depending on the interplay of macroeconomic factors, project developments, and broader market sentiment.
Strategic Considerations for Investors
For investors and traders, the key lies in patience and precision. A confirmed breakout-defined by a closing price beyond the triangle's trend lines and a corresponding spike in volume-would provide a high-probability entry point. Given the potential $1.60 target noted in the TronWeekly analysis, a bullish breakout could unlock significant upside, particularly if the token attracts renewed institutional interest or integrates with broader blockchain ecosystems. Conversely, a bearish breakdown would likely see FET retest critical support levels, potentially triggering a reevaluation of its fundamental value proposition.
The strategic inflection point FET faces is not merely technical but also psychological. A successful breakout could reinvigorate market confidence in the token's utility within decentralized AI and data markets, while a failure to break out might lead to prolonged consolidation or a retest of earlier price levels. Investors are advised to monitor on-chain metrics, such as wallet activity and developer updates, alongside traditional technical indicators to gauge the sustainability of any breakout.
Conclusion
FET's positioning within a symmetrical triangle pattern underscores a pivotal moment in its market journey. While the pattern itself offers a probabilistic roadmap for potential price movements, the ultimate direction will depend on the interplay of technical, fundamental, and macroeconomic factors. For now, the token's price action and volume dynamics suggest a market bracing for a decisive move. As the apex nears, the coming weeks will be critical in determining whether FET transitions into a new phase of growth or faces a period of recalibration.


Comentarios
Aún no hay comentarios