
FET's Critical Juncture: Technical Momentum and Strategic Entry Points for Long-Term Investors
FET, the native token of the Fetch.ai network, is at a pivotal moment in its price trajectory. Recent technical analysis reveals a confluence of patterns and indicators that could determine whether the asset transitions into a bullish phase or reverts to bearish consolidation. For long-term investors, understanding these dynamics is critical to identifying strategic entry points amid a volatile market environment.
Technical Momentum: A Battle for Control
FET's price action on the 4-hour chart has reached a descending trendline resistance, a key battleground for bulls and bears. A successful breakout above this level could propel the price toward $0.75, signaling a shift in short-term sentiment toward bullish momentum[1]. Conversely, rejection at this level risks a retracement to the $0.65–$0.61 support range, which has historically acted as both a psychological and technical floor[1].
On the weekly timeframe, FETFET-- exhibits a classic head and shoulders pattern, a bearish reversal formation. A weekly close below the neckline—aligned with an ascending trendline—could confirm a breakdown toward $0.70 or lower[4]. However, the price has also faced rejection at the Gann arc and 0.618 Fibonacci retracement level (~$1.68), a significant resistance zone. A break above this could trigger a continuation toward ~$2.10, aligning with the next major Fibonacci level[4].
Short-term technical indicators further complicate the narrative. The Chaikin Money Flow (CMF) has turned upward, suggesting renewed buying pressure[1], while the RSI-14 is near oversold territory (36.38), and the MACD histogram (-0.007) indicates slowing bearish momentum[3]. These signals hint at a potential reversal, but on-chain data reveals mixed signals: increased exchange inflows and rising selling pressure could temper bullish optimism[2].
Strategic Entry Points for Long-Term Investors
For investors with a long-term horizon, two key entry zones emerge from the analysis:
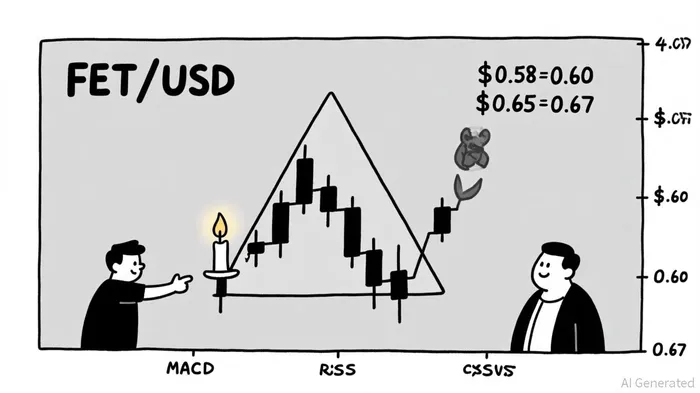
Conservative Long Setup ($0.58–$0.60):
This range aligns with the 200-day SMA, a historical support level that has held since May[1]. A retest of this zone offers a high-probability entry, with potential targets at $0.70 (17% gain), $1.00 (67% gain), and $1.27 (113% gain)[2]. The RSI divergence on the 4H chart and declining volume during pullbacks suggest accumulation is underway[2], increasing the likelihood of a sustained rebound.Aggressive Long Setup ($0.62–$0.6357):
This level targets the midline of a symmetrical triangle pattern and requires confirmation via a retest of the triangle's upper boundary and RSI >50[2]. Success here could drive FET toward $0.70, $0.75, and $0.818, offering a 1:2.5 risk-reward ratio. However, this setup carries higher risk if the price fails to break above $0.625, potentially leading to a retest of the August 30 swing low at $0.579[3].
Broader Market Context and Catalysts
While FET's technicals are compelling, macroeconomic factors cannot be ignored. The cryptocurrency market remains influenced by Bitcoin's performance, institutional adoption, and regulatory clarity[4]. For instance, Bitcoin's recent rally has highlighted how macroeconomic tailwinds—such as reduced interest rate expectations and geopolitical stability—can drive altcoin momentum. If BitcoinBTC-- continues its upward trajectory, FET could benefit from a broader risk-on sentiment in the crypto space.
Additionally, FET's role in the Artificial Superintelligence (ASI) Alliance—a merger with AGIX and OCEAN—bolsters its long-term fundamentals. Initiatives like the $10,000 developer challenge at ETHGlobal NY underscore Fetch.ai's commitment to decentralized AI infrastructure[3]. As the AI sector grows—driven by NVIDIA's AI chip demand and China's "AI Plus" policy—FET's utility in this ecosystem could drive sustained demand[3].
Conclusion: Positioning for the Long Term
FET's current price action presents a high-stakes scenario for both bulls and bears. For long-term investors, the key is to balance technical signals with macroeconomic context. A conservative entry at $0.58–$0.60 offers a low-risk opportunity to capitalize on potential bullish momentum, while an aggressive setup at $0.62–$0.6357 targets higher gains but requires closer monitoring of volume and on-chain activity.
As the ASI Alliance continues to drive innovation in decentralized AI, FET's fundamentals remain robust. However, investors must remain vigilant: a breakdown below $0.58 could prolong the bearish phase, while a confirmed breakout above $0.65 may unlock multi-month gains. In a market where timing and patience are paramount, FET's next move could define its trajectory for the remainder of 2025 and beyond.


Comentarios
Aún no hay comentarios