
Femto's 15min chart signals Bearish Marubozu, Bollinger Bands Narrowing.
PorAinvest
miércoles, 28 de mayo de 2025, 12:48 pm ET1 min de lectura
BTC--
Bollinger Bands Narrowing
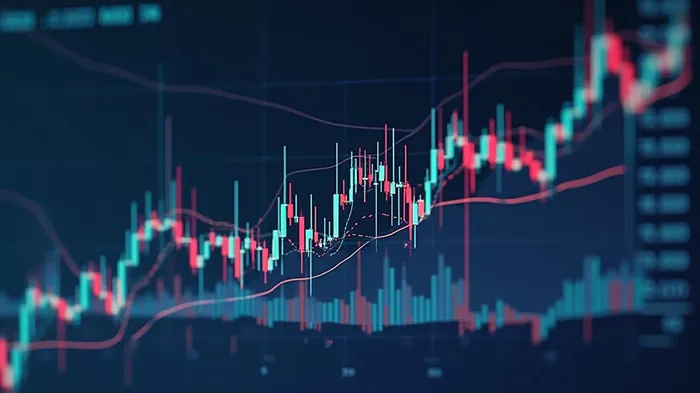
Bollinger Bands are technical indicators that measure volatility by plotting standard deviations above and below a moving average. A narrowing of these bands indicates reduced volatility, as seen in Femto's recent chart. This pattern suggests that the market is consolidating, and significant price movements are less likely to occur in the short term.
Bearish Marubozu Candlestick Pattern
A Marubozu candlestick pattern is characterized by a long body with no upper or lower shadows, indicating that the stock price moved in a single direction throughout the trading session. In Femto's case, the Marubozu pattern was bearish, with the stock price closing lower than it opened. This pattern signifies strong selling pressure and a potential continuation of the downward trend.
Implications for Investors
The combination of narrowing Bollinger Bands and a bearish Marubozu candlestick pattern suggests that Femto is in a period of consolidation, with sellers currently dominant. Investors should be cautious and monitor the stock for any signs of a breakout or reversal in trend. Traders often use these indicators to inform their short-term trading strategies, but it is essential to consider other factors and maintain a diversified portfolio.
Conclusion
The recent narrowing of Bollinger Bands and bearish Marubozu candlestick pattern in Femto's 15-minute chart indicate a period of reduced volatility and strong selling pressure. Investors should exercise caution and closely monitor the stock for any signs of a trend reversal. As always, it is crucial to consider a variety of factors and maintain a balanced investment approach.
References
[1] https://cryptonewsland.com/bitcoin-bollinger-compressed-as-holds-107k/
[2] https://m.economictimes.com/markets/stocks/news/bullish-momentum-6-stocks-with-white-marubozu-pattern-on-may-23/angel-one/slideshow/121403486.cms
[3] https://www.forbes.com/sites/greatspeculations/2025/05/28/buy-or-sell-mrvl-stock-ahead-of-its-earnings/
[4] https://www.tradingview.com/news/barchart:c81949dfa094b:0-3-reasons-why-wall-street-loves-ge-vernova-stock/
FEMB--
FMTO--
The 15-minute chart for Femto has recently exhibited a narrowing of Bollinger Bands, accompanied by a bearish Marubozu candlestick pattern at 05/28/2025 12:45. This suggests a decrease in the magnitude of stock price fluctuations, indicating that sellers are currently in control of the market. Furthermore, this bearish momentum is likely to persist in the near future.
The 15-minute chart for Femto (FEMP) has recently shown a narrowing of its Bollinger Bands, accompanied by a bearish Marubozu candlestick pattern at 05/28/2025 12:45. This suggests a decrease in the magnitude of stock price fluctuations, indicating that sellers are currently in control of the market. Furthermore, this bearish momentum is likely to persist in the near future.Bollinger Bands Narrowing
Bollinger Bands are technical indicators that measure volatility by plotting standard deviations above and below a moving average. A narrowing of these bands indicates reduced volatility, as seen in Femto's recent chart. This pattern suggests that the market is consolidating, and significant price movements are less likely to occur in the short term.
Bearish Marubozu Candlestick Pattern
A Marubozu candlestick pattern is characterized by a long body with no upper or lower shadows, indicating that the stock price moved in a single direction throughout the trading session. In Femto's case, the Marubozu pattern was bearish, with the stock price closing lower than it opened. This pattern signifies strong selling pressure and a potential continuation of the downward trend.
Implications for Investors
The combination of narrowing Bollinger Bands and a bearish Marubozu candlestick pattern suggests that Femto is in a period of consolidation, with sellers currently dominant. Investors should be cautious and monitor the stock for any signs of a breakout or reversal in trend. Traders often use these indicators to inform their short-term trading strategies, but it is essential to consider other factors and maintain a diversified portfolio.
Conclusion
The recent narrowing of Bollinger Bands and bearish Marubozu candlestick pattern in Femto's 15-minute chart indicate a period of reduced volatility and strong selling pressure. Investors should exercise caution and closely monitor the stock for any signs of a trend reversal. As always, it is crucial to consider a variety of factors and maintain a balanced investment approach.
References
[1] https://cryptonewsland.com/bitcoin-bollinger-compressed-as-holds-107k/
[2] https://m.economictimes.com/markets/stocks/news/bullish-momentum-6-stocks-with-white-marubozu-pattern-on-may-23/angel-one/slideshow/121403486.cms
[3] https://www.forbes.com/sites/greatspeculations/2025/05/28/buy-or-sell-mrvl-stock-ahead-of-its-earnings/
[4] https://www.tradingview.com/news/barchart:c81949dfa094b:0-3-reasons-why-wall-street-loves-ge-vernova-stock/
Divulgación editorial y transparencia de la IA: Ainvest News utiliza tecnología avanzada de Modelos de Lenguaje Largo (LLM) para sintetizar y analizar datos de mercado en tiempo real. Para garantizar los más altos estándares de integridad, cada artículo se somete a un riguroso proceso de verificación con participación humana.
Mientras la IA asiste en el procesamiento de datos y la redacción inicial, un miembro editorial profesional de Ainvest revisa, verifica y aprueba de forma independiente todo el contenido para garantizar su precisión y cumplimiento con los estándares editoriales de Ainvest Fintech Inc. Esta supervisión humana está diseñada para mitigar las alucinaciones de la IA y garantizar el contexto financiero.
Advertencia sobre inversiones: Este contenido se proporciona únicamente con fines informativos y no constituye asesoramiento profesional de inversión, legal o financiero. Los mercados conllevan riesgos inherentes. Se recomienda a los usuarios que realicen una investigación independiente o consulten a un asesor financiero certificado antes de tomar cualquier decisión. Ainvest Fintech Inc. se exime de toda responsabilidad por las acciones tomadas con base en esta información. ¿Encontró un error? Reportar un problema

SOBRE NOSOTROS
Nuestra historiaAutores de noticiasBase de conocimientosPolítica de privacidadTérmino de usoDescargo de responsabilidad de corretaje de tercerosTérminos de uso de AIMEDivulgaciones de riesgos de AInvest AICarrerasCONTÁCTENOS
Email: support@ainvest.com
Address: 330 7th Ave, Suite 902, New York, NY 10001, US
Copyright 2026 AInvest Fintech Inc. All rights reserved.
Comentarios
Aún no hay comentarios