
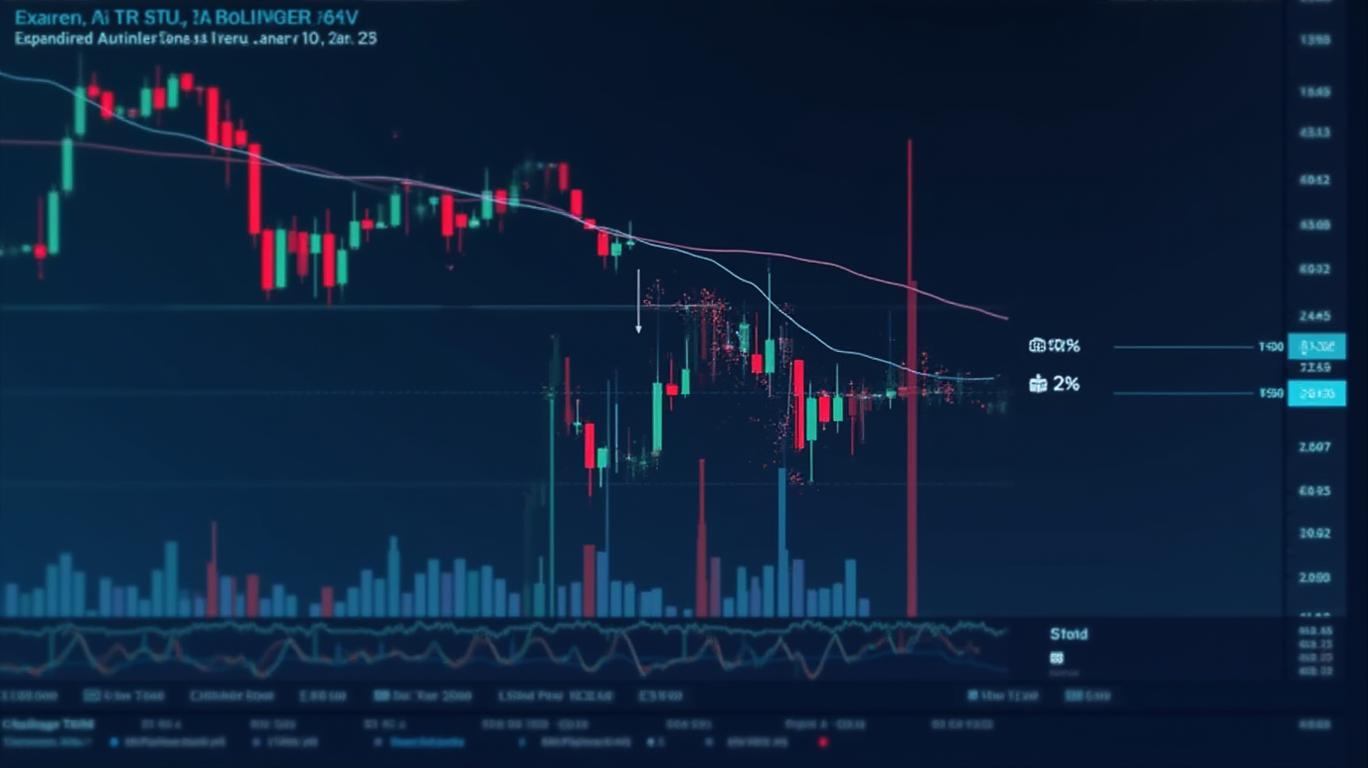
Exagen's 15min chart indicates bearish sentiment with Bollinger Bands expanding downward.
PorAinvest
viernes, 10 de enero de 2025, 10:47 am ET1 min de lectura
EXG--
Bollinger Bands, a popular indicator used in technical analysis, consist of three lines: the middle band, which is a moving average, and the upper and lower bands, which are two standard deviations away from the moving average [2]. When the Bollinger Bands expand, it indicates that volatility is increasing, and the price is moving further away from the moving average. In the case of Exagen, the expanding Bollinger Bands on the 15-minute chart suggest that the stock is experiencing increased volatility and selling pressure.
The bearish Marubozu formation, which is a bullish candlestick with a long upper shadow and a short lower shadow, indicates that the stock opened at a high price, but the selling pressure caused the price to close significantly lower than the opening price [3]. This formation suggests that there was a significant shift in market sentiment from bullish to bearish during the day.
It is worth noting that while these indicators suggest a bearish outlook for Exagen, they should not be used in isolation. Traders should consider other factors such as fundamental analysis, market conditions, and risk management when making investment decisions.
References:
[1] Pinescripters.net. (n.d.). Bollinger Bands on higher time frame. Retrieved January 13, 2023, from https://pinescripters.net/viewtopic.php?t=583
[2] Investopedia. (n.d.). Bollinger Bands. Retrieved January 13, 2023, from https://www.investopedia.com/terms/b/bollingerbands.asp
[3] Investopedia. (n.d.). Marubozu. Retrieved January 13, 2023, from https://www.investopedia.com/terms/m/marubozu.asp
XGN--
Based on the 15-minute chart for Exagen, the Bollinger Bands have been expanding downward, accompanied by a bearish Marubozu at 10:45 on January 10, 2023. This suggests that market sentiment is currently dominated by sellers, with a likelihood of sustained bearish momentum.
The 15-minute chart for Exagen (EXG) has been exhibiting bearish signs, with expanding Bollinger Bands and a bearish Marubozu formation on January 10, 2023, at 10:45 [1]. These indicators suggest that market sentiment is currently dominated by sellers, with a likelihood of sustained bearish momentum.Bollinger Bands, a popular indicator used in technical analysis, consist of three lines: the middle band, which is a moving average, and the upper and lower bands, which are two standard deviations away from the moving average [2]. When the Bollinger Bands expand, it indicates that volatility is increasing, and the price is moving further away from the moving average. In the case of Exagen, the expanding Bollinger Bands on the 15-minute chart suggest that the stock is experiencing increased volatility and selling pressure.
The bearish Marubozu formation, which is a bullish candlestick with a long upper shadow and a short lower shadow, indicates that the stock opened at a high price, but the selling pressure caused the price to close significantly lower than the opening price [3]. This formation suggests that there was a significant shift in market sentiment from bullish to bearish during the day.
It is worth noting that while these indicators suggest a bearish outlook for Exagen, they should not be used in isolation. Traders should consider other factors such as fundamental analysis, market conditions, and risk management when making investment decisions.
References:
[1] Pinescripters.net. (n.d.). Bollinger Bands on higher time frame. Retrieved January 13, 2023, from https://pinescripters.net/viewtopic.php?t=583
[2] Investopedia. (n.d.). Bollinger Bands. Retrieved January 13, 2023, from https://www.investopedia.com/terms/b/bollingerbands.asp
[3] Investopedia. (n.d.). Marubozu. Retrieved January 13, 2023, from https://www.investopedia.com/terms/m/marubozu.asp


Divulgación editorial y transparencia de la IA: Ainvest News utiliza tecnología avanzada de Modelos de Lenguaje Largo (LLM) para sintetizar y analizar datos de mercado en tiempo real. Para garantizar los más altos estándares de integridad, cada artículo se somete a un riguroso proceso de verificación con participación humana.
Mientras la IA asiste en el procesamiento de datos y la redacción inicial, un miembro editorial profesional de Ainvest revisa, verifica y aprueba de forma independiente todo el contenido para garantizar su precisión y cumplimiento con los estándares editoriales de Ainvest Fintech Inc. Esta supervisión humana está diseñada para mitigar las alucinaciones de la IA y garantizar el contexto financiero.
Advertencia sobre inversiones: Este contenido se proporciona únicamente con fines informativos y no constituye asesoramiento profesional de inversión, legal o financiero. Los mercados conllevan riesgos inherentes. Se recomienda a los usuarios que realicen una investigación independiente o consulten a un asesor financiero certificado antes de tomar cualquier decisión. Ainvest Fintech Inc. se exime de toda responsabilidad por las acciones tomadas con base en esta información. ¿Encontró un error? Reportar un problema

SOBRE NOSOTROS
Nuestra historiaAutores de noticiasBase de conocimientosPolítica de privacidadTérmino de usoDescargo de responsabilidad de corretaje de tercerosTérminos de uso de AIMEDivulgaciones de riesgos de AInvest AICarrerasCONTÁCTENOS
Email: support@ainvest.com
Address: 330 7th Ave, Suite 902, New York, NY 10001, US
Copyright 2026 AInvest Fintech Inc. All rights reserved.
Comentarios
Aún no hay comentarios