
Evaluating the Bearish Turn in ETH Futures: Market Correction or Deeper Structural Shift?
The EthereumETH-- (ETH) derivatives market is at a crossroads in 2025, with conflicting signals emerging from technical indicators and sentiment metrics. While bullish fundamentals—such as institutional adoption, whale accumulation, and network upgrades—suggest a strong foundation, bearish derivatives data and shifting sentiment raise questions about whether the current pullback is a temporary correction or a sign of deeper structural fragility.
Technical Indicators: A Tale of Two Narratives
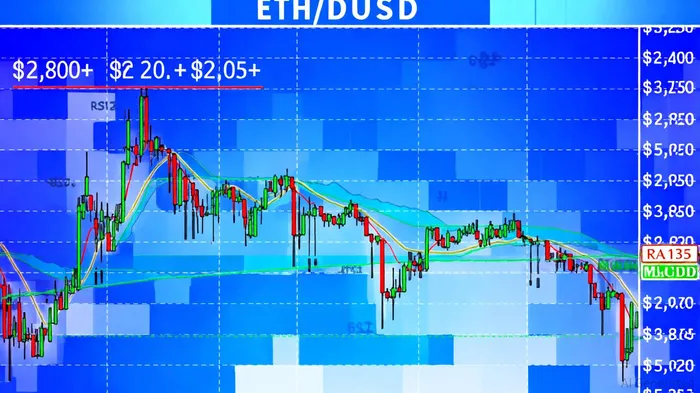
Ethereum's price action remains locked in a consolidation phase between $2,480 and $2,750, with the $2,800–$2,850 zone acting as a critical resistance level[1]. A breakout above this range could trigger a rally toward $3,000 and beyond, supported by on-chain data showing a declining exchange supply and increased staking activity[3]. Whale wallets have added over 871,000 ETH in a single day, reflecting historic accumulation by long-term holders[2].
However, bearish technical indicators paint a contrasting picture. Ethereum is currently trading below nine out of ten major moving averages, a condition often associated with downward gravitational pull[1]. The Relative Strength Index (RSI) at 42.02 and MACD at 13.05 signal bearish momentum, with the former trending toward oversold territory and the latter remaining below the signal line in negative territory[6]. Additionally, Ethereum's price has fallen below the realized price, a key on-chain metric that often signals panic selling[5].
The derivatives market amplifies these tensions. While open interest (OI) for ETH futures has surged to an all-time high of $20.8 billion, reflecting bullish speculative activity[4], recent data shows a 0.83% decline in OI to $63.32 billion over 24 hours[1]. This volatility underscores the fragility of long positions, as a sharp price drop could trigger a cascade of liquidations.
Sentiment Analysis: Fear, Greed, and the Derivatives Divide
Sentiment metrics reveal a fractured market. The Ethereum Fear and Greed Index dropped to 49 on September 19, 2025, entering "Fear" territory[1]. This shift aligns with increased short positioning, which has surged 500% since November 2024[4], and a high Put/Call ratio in options markets, signaling bearish expectations[2]. Meanwhile, social media sentiment remains mixed. While AltIndex reports a bullish score of 83 out of 100[4], academic research on Twitter engagement highlights a "mixed impact" on price movements[3].
Derivatives data further complicates the narrative. The OI-weighted funding rate for ETH futures has hit all-time highs at 0.0374%, indicating long dominance[4]. Yet, negative funding rates in perpetual futures and declining ETF inflows suggest growing pessimism[5]. This duality reflects a market caught between institutional optimism and retail caution.
Institutional Adoption vs. Structural Risks
Institutional adoption remains a cornerstone of Ethereum's bullish case. U.S. spot ETH ETFs have driven $11 billion in year-to-date net inflows[5], while high-profile staking activities and upgrades like Pectra and EIP-1559 reinforce its deflationary narrative[2]. However, regulatory uncertainties and competition from platforms like SolanaSOL-- pose existential risks[5].
The broader market environment also weighs on ETH. A 3.07% price drop to $4,168 has pushed Ethereum below key short-term moving averages, with bearish MACD divergence amplifying concerns[2]. While network upgrades and Layer 2 scalability improvements bolster long-term fundamentals[1], short-term volatility remains a wildcard.
Conclusion: Correction or Structural Shift?
The current bearish turn in ETH futures appears to straddle both a market correction and early signs of structural fragility. On one hand, technical indicators and derivatives data suggest a vulnerable long position, with risks of a liquidity-driven selloff. On the other, institutional inflows, whale accumulation, and network upgrades provide a robust foundation for a potential rebound.
Investors must weigh these factors carefully. A breakout above $2,800 could reignite bullish momentum, but a failure to hold key support levels may signal deeper bearish pressures. As the market navigates this inflection point, the interplay between technical resilience and sentiment shifts will determine Ethereum's trajectory in the coming months.


Comentarios
Aún no hay comentarios