
Ethereum’s Fractal Price Pattern and Institutional Adoption Signal a High-Probability Breakout
Ethereum’s price trajectory in 2025 has ignited a confluence of technical and macroeconomic signals that suggest a high-probability breakout. The cryptocurrency’s fractal price pattern, reminiscent of its 2017 bull run and Bitcoin’s 2018–2021 cycle, has been reinforced by institutional adoption, regulatory clarity, and structural upgrades. This analysis synthesizes technical indicators, on-chain metrics, and macroeconomic tailwinds to argue that EthereumETH-- is poised for a parabolic move.
Technical Analysis: Fractals and Key Resistance Levels
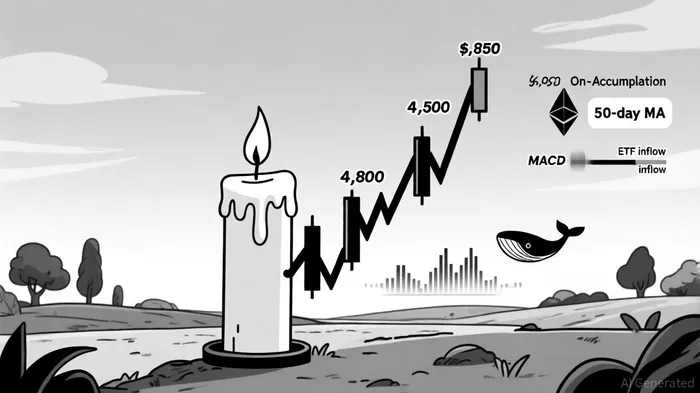
Ethereum’s recent breakout above the $4,000 resistance level on August 14, 2025, marks a critical inflection point. This move was confirmed by a 50-day moving average (MA) crossover and a MACD golden cross, both of which historically signal sustained bullish momentum [1]. The fractal pattern—defined by repeating price structures across timeframes—mirrors Ethereum’s 2017 rebound but with amplified volume and institutional participation. Analysts project that a weekly close above $4,550 could trigger a parabolic surge to $6,800, with long-term targets extending to $15,650–$20,000 [1][3].
Fractal and Wyckoff pattern analyses further validate this thesis. Ethereum’s price action in 2025 exhibits a “distribution” phase followed by a “accumulation” phase, a classic setup for a breakout. On-chain data underscores this: whale accumulation has reached 9.31%, while record $9.4 billion in Ethereum ETF inflows reflect institutional confidence [1]. These signals align with historical precedents, where fractal patterns in BitcoinBTC-- and Ethereum have preceded multi-year bull markets [4].
Institutional Adoption: Staking Yields and ETF Inflows
Ethereum’s institutional adoption in 2025 is driven by its 3.8% annual staking yield, which outpaces traditional financial instruments like savings accounts (0.5%) and corporate bonds (3.75%) [1][5]. This yield, combined with liquid staking tokens (LSTs), allows investors to earn rewards without locking capital—a flexibility absent in Bitcoin’s staking ecosystem [2]. Over 35.7 million ETH (29.6% of total supply) is now staked, reinforcing Ethereum’s scarcity and value proposition [1].
The approval of spot-ETH ETFs in 2024 has further catalyzed adoption. By Q3 2025, these ETFs attracted $29.22 billion in net inflows, dwarfing Bitcoin’s $178 million in the same period [5]. BlackRock’s iShares Ethereum Trust (ETHA) alone captured $27.6 billion in assets under management (AUM), signaling a shift in institutional capital from Bitcoin to Ethereum [3]. This trend is supported by the SEC’s reclassification of Ethereum as a utility token under the CLARITY Act, which removed regulatory barriers for staking platforms [2].
Macroeconomic Tailwinds: Dovish Policy and RWA Tokenization
Ethereum’s performance is also tied to macroeconomic conditions. The Federal Reserve’s dovish pivot, signaled at the Jackson Hole symposium in September 2025, has driven institutional capital toward high-beta assets. Ethereum’s beta to Fed policy (4.7) exceeds Bitcoin’s (2.8), making it more responsive to rate cuts [2]. With an 87.3% probability of a 25-basis-point rate cut priced into markets, Ethereum surged 13% post-symposium, outperforming Bitcoin [2].
Ethereum’s role in real-world asset (RWA) tokenization further amplifies its macroeconomic appeal. By mid-2025, the network supports $24 billion in RWA tokenization, including $10.8 billion in U.S. Treasuries and $8.32 billion in gold [1]. This shift reflects institutions treating ETH as a treasury asset rather than a speculative investment. The GENIUS Act and SEC’s regulatory clarity have accelerated this trend, attracting $27.6 billion in ETH ETF inflows by Q3 2025 [1].
Structural Upgrades: Dencun and EIP-4844
Ethereum’s technological upgrades have solidified its position as a global financial infrastructure layer. The Dencun and Pectra upgrades reduced Layer-2 data costs by 90%, enhancing scalability and reducing gas fees [5]. EIP-4844, which improved L2 scalability by 100x, contributed to a 38% quarter-over-quarter increase in total value secured (TVL) on L2 networks [2]. These upgrades have made Ethereum the backbone of DeFi, with TVL surging to $86 billion in 2025 [5].
Risks and Conclusion
While the bullish case is compelling, risks remain. Global interest rate fluctuations and regulatory uncertainties could temper growth. However, Ethereum’s deflationary supply model, reinforced by EIP-1559’s transaction fee burns, creates a self-sustaining value proposition. Annual ETH supply reductions of millions of tokens have driven a 9.4% increase in realized cap and $20 billion in daily trading volumes [2].
If ETF inflows, whale accumulation, and network upgrades align with bullish macroeconomic conditions, Ethereum could deliver extraordinary returns—possibly reaching 15x ROI by 2025. Investors should approach with balanced expectations but recognize the convergence of technical, on-chain, and macroeconomic signals as a high-probability catalyst for a breakout.
Source:
[1] Ethereum's 15x ROI Potential in 2025: Staking, Institutional Growth and Market Outlook [https://thecurrencyanalytics.com/altcoins/ethereums-15x-roi-potential-in-2025-staking-institutional-growth-and-market-outlook-195157]
[2] Ethereum as the Next Decade's Macro-Driven Financial Infrastructure [https://www.bitget.com/news/detail/12560604940901]
[3] Ethereum's $5000 Breakout and the Rise of Layer 2 Meme [https://www.bitget.com/asia/news/detail/12560604933956]
[4] Ethereum's 2025 Fractal Echoes Bitcoin's Historic 2018-2021 Rally [https://www.btcc.com/en-US/square/Newsbtc/777958]
[5] Cryptocurrency Staking Statistics 2025: Yields, Top Assets, and More [https://coinlaw.io/cryptocurrency-staking-statistics/]


Comentarios
Aún no hay comentarios