
Ethereum's Critical Technical Setup Against Bitcoin: A Pathway to 95% Gains or a False Dawn?
The Ethereum-Bitcoin (ETH/BTC) pair has long been a barometer for cross-chain sentiment, and as 2025 draws to a close, the charts tell a story of conflicting narratives. On one hand, a textbook inverse head-and-shoulders pattern on the weekly ETH/BTC chart suggests a potential 95% rally to 0.066 BTCBTC-- if the neckline at 0.042 BTC is breached. On the other, a bear pennant on the three-day chart hints at a short-term breakdown risk, with a potential drop to 0.024–0.025 BTC. This dichotomy forces traders to weigh the odds of a bullish reversal against the specter of a bearish continuation.
The Bullish Case: Inverse Head-and-shoulders and Historical Parallels
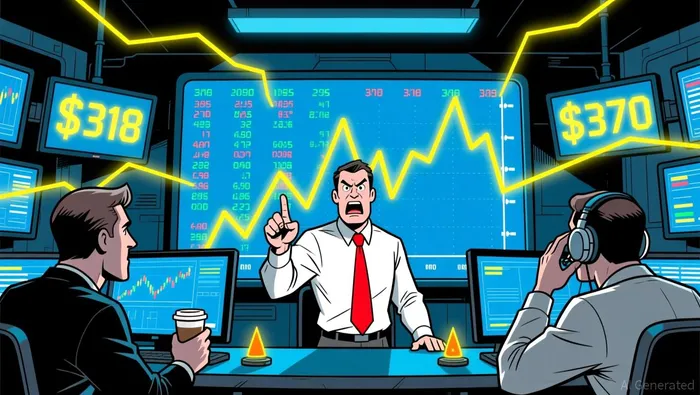
The inverse head-and-shoulders pattern on the ETH/BTC weekly chart is a textbook setup. Formed with a left shoulder in mid-2024, a deeper trough in early 2025, and a higher low in late 2025, the pattern mirrors Ethereum's 2019–2021 rally. If history repeats, a breakout above the neckline could propel ETH/BTC to 0.066 BTC, translating to a 95% gain from current levels. This pattern gains credibility from Ethereum's broader falling wedge on the daily chart, where key resistance levels at $318–$320 and $370–$400 could act as catalysts for a breakout.
Moreover, on-chain data adds fuel to the bullish thesis. Whale activity, including a $6 million long order at $2,860, signals renewed buying interest. Institutional investors have also increased holdings, reinforcing the idea that large players are positioning for a rebound. A Wyckoff accumulation sequence on the weekly chart further supports a transition into a bullish phase, with a target near $10,000.
The Bearish Counterargument: Bear Pennant and Short-Term Weakness
Despite the bullish setup, Ethereum's technicals are far from unambiguous. A bear pennant on the three-day ETH/BTC chart suggests consolidation ahead of a potential breakdown. If the price falls below the pennant's lower boundary, it could accelerate toward 0.024–0.025 BTC, a level last seen during the 2023 bear market. This pattern is compounded by a traditional head-and-shoulders top on the 4-hour chart, which projects a drop to $2,400 if the neckline at $2,800 is breached.
The RSI at 48% underscores a neutral-to-bearish sentiment, with the market teetering on the edge of a breakdown. A failure to hold above $2,800 could trigger a cascade of stop-loss orders, pushing EthereumETH-- into a deeper correction. Additionally, a Price Action Channel Up pattern on the 4-hour chart reinforces the bearish bias, with a key support level at 3081.20.
Market Context: Accumulation vs. Distribution
The tug-of-war between bulls and bears is further complicated by mixed on-chain signals. While large holders have been defending a realized price of $2,796, the market remains range-bound between $2,780–$2,820 and $3,040–$3,080. This indecision reflects a broader struggle between accumulation and distribution.
Bitcoin's own inverse head-and-shoulders pattern, with a potential target of $117,000, adds another layer of complexity. If BitcoinBTC-- breaks above $113,000, it could create a tailwind for Ethereum, as cross-chain correlations often amplify bullish momentum. However, a breakdown in Bitcoin below $109,000 would likely drag Ethereum lower, invalidating the ETH/BTC bullish case.
Conclusion: A High-Stakes Technical Crossroads
Ethereum's December 2025 chart is a microcosm of the broader crypto market's duality. The inverse head-and-shoulders pattern offers a tantalizing 95% upside, but the bear pennant and head-and-shoulders top on shorter timeframes pose immediate risks. Traders must monitor key levels: a sustained close above $3,000 could validate the bullish case, while a breakdown below $2,800 would signal a deeper correction.
In this high-stakes environment, patience and risk management are paramount. The coming weeks will test whether Ethereum can consolidate its gains or if the bearish forces will prevail. For now, the market remains in a state of anticipation, with the outcome hinging on the delicate balance between technical patterns and on-chain sentiment.


Comentarios
Aún no hay comentarios