
Ethereum's Critical Price Resistance and the Surge in Stablecoin Supply: A Convergence of On-Chain and Macro Trends
Ethereum's price action in 2025 has been a masterclass in the interplay between on-chain fundamentals and macroeconomic forces. As the cryptocurrency consolidates near $4,533 in late September 2025, two structural catalysts stand out: critical price resistance levels and a record surge in stablecoin supply. These factors, when analyzed together, reveal a compelling narrative for identifying strategic entry points in the crypto market.
Critical Price Resistance: The On-Chain Playbook
Ethereum's price trajectory in 2025 has been shaped by a series of well-defined resistance and support levels. As of late September 2025, the network is testing key resistance zones around $4,550–$4,765, with $4,550 acting as a psychological and technical fulcrum. A breakout above this level could trigger a move toward $5,000 and potentially $7,000 by year-end, according to analysts[5]. Conversely, a failure to hold above $4,500 could see the price retest support at $4,200 or even $3,800[4].
On-chain metrics reinforce this dynamic. Whale activity has intensified, with large holders (wallets holding 10,000+ ETH) increasing their holdings by 9.31% in recent months[1]. Over 820,000 ETH—worth nearly $3.8 billion—has flowed into accumulation addresses in the $4,500–$4,533 range[2]. This suggests institutional confidence in Ethereum's long-term value, even as short-term volatility persists.
Technical indicators also paint a nuanced picture. The RSI hovers at 59, while the Stochastic Oscillator nears 85, signaling overbought conditions[1]. Meanwhile, the MACD shows diminishing bullish momentum, hinting at a potential consolidation phase before the next leg higher[2]. For traders, these signals underscore the importance of monitoring volume and order book depth at $4,550 and $4,765. A clean break above these levels could validate the bullish case, while a breakdown would likely force a retest of the $4,200 support zone[5].
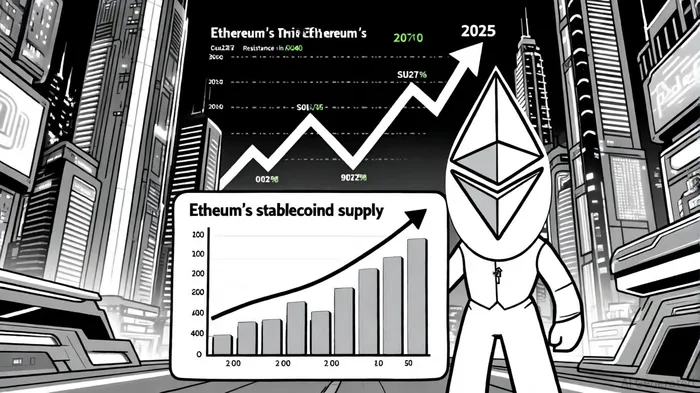
Stablecoin Surge: A Macro Tailwind
While on-chain dynamics set the stage, macroeconomic trends—particularly the explosion of stablecoin supply on Ethereum—provide the tailwind. As of September 2025, stablecoin supply on the EthereumETH-- network has surged to $170 billion, up 100% from January 2024 and 12% from August 2025[5]. USDT and USDCUSDC-- dominate this growth, with $87.8 billion and $48 billion in supply, respectively[2].
This surge is notNOT-- merely a liquidity story—it's a structural shift in how capital flows through the crypto ecosystem. Stablecoins now account for 57% of the global stablecoin market and 77% of tokenized commodities[4]. For Ethereum, this means two critical advantages:
1. Reduced Exchange Liquidity Pressure: The Exchange Supply Ratio (ESR) has plummeted to 0.139, historically low levels that signal minimal ETHETH-- held on centralized exchanges and reduced selling pressure[1].
2. Network Effects Reinforcement: Every stablecoin transfer consumes ETH for gas, tightening supply dynamics under EIP-1559 and indirectly supporting higher prices[2]. Analysts like Tom Lee argue this could trigger a “supercycle” akin to historical financial transitions[5].
The correlation between stablecoin supply and ETH price is also evident. As stablecoin liquidity grows, so does the demand for Ethereum as a settlement layer. This creates a self-reinforcing loop: more stablecoin activity → higher gas demand → tighter ETH supply → upward price pressure[3].
Strategic Entry Points: Where On-Chain and Macro Align
For investors, the convergence of these trends creates high-probability entry points. Here's how to position for the next phase:
- Support Zones as Accumulation Targets:
$4,500–$4,533: This range has seen heavy whale accumulation and institutional inflows. A pullback to this zone could offer a low-risk entry, especially if stablecoin supply continues to grow[2].
$4,200–$3,800: While deeper, these levels represent historical support and could attract large holders defending their positions[6].
Breakout Scenarios:
- Above $4,550: A confirmed breakout here would validate the bullish case, with targets at $5,000 and $7,000. Traders should look for volume spikes and order book liquidity clusters at $4,640–$4,765[2].
Below $4,500: A breakdown would likely see a retest of $4,200, but the low ESR and stablecoin-driven liquidity could limit downside risk[1].
Macro-Driven Catalysts:
- ETF Inflows and Staking Yields: Ethereum ETFs have received $33 billion in inflows this quarter, with staking yields hitting 3.8% APY post-CLARITY Act[3]. These factors create a floor for ETH's price, even during corrections.
- Protocol Upgrades: The Fusaka upgrade in December 2025 is expected to enhance scalability and reduce transaction costs, adding further upward pressure[1].
Conclusion: A Convergence of Forces
Ethereum's 2025 rally is not a single-threaded story—it's the result of on-chain resilience and macroeconomic tailwinds working in tandem. The critical resistance levels at $4,550–$4,765 and the surge in stablecoin supply represent a unique inflection point. For investors, the key is to align entry points with these structural catalysts: buying during pullbacks to $4,500–$4,200 while monitoring volume and order book depth for breakout confirmation.
As the crypto market enters its final quarter of 2025, Ethereum's ability to break through these resistance levels—and sustain the momentum—will likely determine whether it reaches $5,000, $7,000, or even $10,000. The on-chain data and stablecoin dynamics suggest the odds are in favor of the bulls.


Comentarios
Aún no hay comentarios