
Ethereum's Bearish Momentum: On-Chain and Technical Signals Point to Near-Term Price Correction
Ethereum (ETH) has entered a critical juncture in October 2025, with on-chain sentiment and technical indicators converging to signal a potential near-term price correction. While the asset enjoyed a robust Q3 2025 rally-surging 80% amid institutional buying and regulatory tailwinds, according to CoinGecko's Q3 report-recent data reveals a sharp shift in market dynamics. This analysis examines the bearish momentum through on-chain metrics, technical patterns, and sentiment shifts, offering a cautionary outlook for investors.
On-Chain Sentiment: A Divergence from Bullish Momentum
Ethereum's on-chain activity, once a cornerstone of its Q3 success, now shows signs of deterioration. The Realized Price-to-Liveliness Ratio (RPLR) and Net Unrealized Profit/Loss (NUPL) have crossed bearish thresholds historically associated with the end of bull cycles, according to a CCN analysis. These metrics suggest that long-term holders are locking in profits or liquidating positions, reducing network resilience. Additionally, Ethereum's circulating supply has expanded due to declining user activity, exacerbating downward pressure, per a Mitrade analysis.
Layer 2 adoption, which previously cushioned gas costs and drove transaction volume, has also plateaued. While ArbitrumARB-- and zkSyncZK-- still process 60% of Ethereum's daily transactions, the lack of growth in this segment signals waning innovation-driven demand, according to a Bitget article. This stagnation contrasts with the explosive TVL growth in Q3, which relied heavily on speculative inflows into perpetual DEX tokens, as outlined in the CoinGecko report.
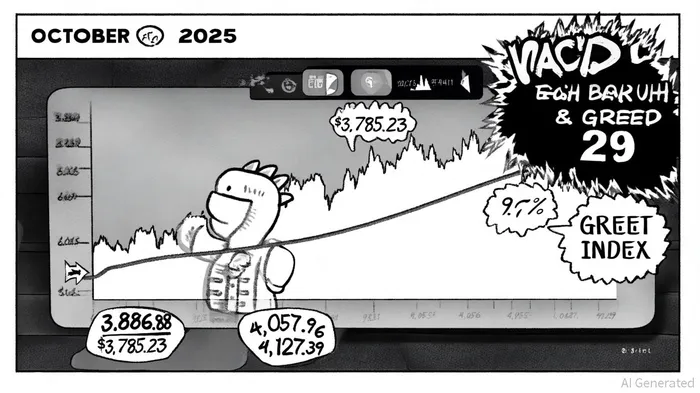
Technical Indicators: Bearish Crossovers and Support-Level Vulnerability
The Moving Average Convergence Divergence (MACD) has confirmed a bearish crossover on the weekly chart-a pattern historically followed by steep price declines of 46% to 60%-a trend noted in the Bitget article. Ethereum's current price of $4,031.16 is trading below key support at $4,000, with further breakdowns threatening levels at $3,886.88 and $3,785.23, per the CoinGecko report. A breach below $3,785 could trigger a cascade to $3,435, aligning with a Blockchain.News prediction.
The Fear & Greed Index, a composite of volatility, market volume, and social sentiment, now reads 29-a "extreme fear" level that historically precedes short-term rallies but often masks deeper structural weakness, as noted in the Mitrade analysis. While some analysts argue this could catalyze a rebound to $4,427, bearish momentum indicators (19 out of 29 negative) suggest this scenario is contingent on immediate institutional intervention, a point also highlighted in the CoinGecko report.
Market Dynamics: Capital Reallocation and ETF Inflows Under Scrutiny
Ethereum's dominance in DeFi, as measured by the ETH/BTC ratio (0.71), reflects ongoing capital reallocation toward altcoins, a dynamic explored in the Bitget article. However, this metric masks fragility in Ethereum's fundamentals. The recent $547 million single-day inflow into EthereumETH-- spot ETFs, reported in the CoinGecko Q3 report, appears to be a short-term anomaly, as broader market jitters-driven by macroeconomic uncertainty and SEC regulatory ambiguity-have dampened sustained institutional demand.
Prediction markets like Polymarket still show a 91% probability of Ethereum closing 2025 above $5,000 (noted in the Mitrade analysis), but this optimism is increasingly disconnected from on-chain realities. The staking rate (29.6% of total supply) remains elevated, as reported in the Bitget article, yet rising yields on alternative assets (e.g., U.S. treasuries) are siphoning liquidity away from crypto, further pressuring ETH's price.
Conclusion: Navigating the Bearish Scenario
Ethereum's technical and on-chain landscape in October 2025 paints a cautionary picture. While short-term rallies are possible-particularly if the $4,000 resistance is retested-structural bearish signals (MACD crossovers, RPLR/NUPL divergence, and declining user activity) suggest a deeper correction is likely. Investors should closely monitor the $3,785 support level, as its breakdown could accelerate a move toward $3,435.
For those maintaining long-term exposure, hedging strategies (e.g., options or staking derivatives) may mitigate downside risk. However, the current environment underscores the importance of aligning investment theses with on-chain fundamentals rather than relying on speculative momentum.


Comentarios
Aún no hay comentarios