
Equity Market Response to Fed Rate Cuts: Pre-Market Momentum and Sector Rotation Strategies in 2025
The Federal Reserve's recent pivot toward rate cuts has reignited debates about equity market responses, particularly in the context of pre-market momentum and sector rotation strategies. As the Fed signals a shift from tightening to easing, investors must navigate a complex interplay of short-term price signals and long-term sectoral trends. Drawing on recent academic research and historical data, this analysis unpacks how equity markets react to rate cuts, with a focus on pre-FOMC announcement dynamics and sector-specific opportunities.
Pre-Market Momentum: A Short-Lived Signal
Academic studies from 2020 to 2025 reveal a consistent but fleeting pattern: equities often exhibit positive excess returns in the 24 hours preceding Federal Open Market Committee (FOMC) announcements, a phenomenon termed the “pre-FOMC announcement drift” [1]. This drift, however, dissipates quickly after the official release, suggesting that markets rapidly incorporate new information. For example, a 2024 study in the Applied Economics journal found that pre-announcement gains in the S&P 500 averaged 0.8% but reversed within 48 hours, leaving no significant residual impact [1].
This dynamic contrasts with earlier findings, such as Lucca and Moench's 2015 research, which identified more persistent effects. The shift underscores evolving market efficiency, where algorithmic trading and real-time data dissemination accelerate price discovery. Notably, the VIX volatility index has also shown a unique pattern: it typically declines before FOMC announcements (as uncertainty wanes) but rebounds afterward, reflecting renewed risk-off sentiment [1]. For investors, this implies that pre-market momentum strategies must act swiftly, as gains are often ephemeral.
Sector Rotation: Context Matters
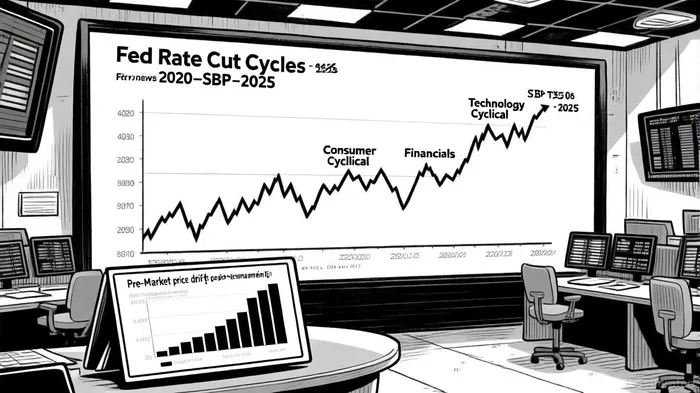
Historical sector rotation during Fed rate cut cycles reveals stark dependencies on macroeconomic conditions. In recessionary environments, sectors like Financials, Energy, and Industrials tend to outperform. For instance, Financials have historically gained over 16% during rate cut pauses, driven by lower borrowing costs and improved credit demand [2]. Conversely, non-recessionary easing cycles—such as those in 1995–1996 and 2023–2025—favor Technology and Consumer Cyclical sectors. The current cycle exemplifies this: Technology stocks have surged 27% since the Fed began easing, fueled by AI-driven secular growth rather than cyclical demand [3].
The divergence between median and average sector performance is also telling. While Technology ranks third in median returns during rate cuts, its average performance lags due to volatility in downturns like 2001 and 2007 [3]. This highlights the importance of aligning sector bets with the broader economic narrative. For example, during the 2023–2025 easing cycle, Consumer Cyclical and Financials have led as the economy strengthens, whereas Utilities and Real Estate have underperformed, acting as bond proxies in a low-yield environment [3].
Implementation Frameworks: Core-Satellite and Momentum-Driven Approaches
Structuring sector rotation strategies requires balancing flexibility and discipline. A core-satellite approach—allocating 60–70% to broad-market holdings and 30–40% to tactical sector positions—offers resilience while allowing for opportunistic shifts [1]. For instance, during the current easing cycle, a satellite tilt toward Technology and Financials has outperformed a purely defensive stance.
Momentum-driven strategies further refine this framework. Sectors maintaining positive momentum for 3–6 months, such as Consumer Cyclical and Energy, have historically continued to outperform [3]. Technical indicators like 50-day moving averages and relative strength indices (RSI) can help identify entry/exit points. For example, the Russell 2000 small-cap index has shown renewed strength as rate cuts reduce financing costs, suggesting a potential shift toward early-cycle stocks [3].
Fixed-income investors, meanwhile, may find opportunities in the “belly” of the Treasury yield curve (3–7 years), which balances yield and duration risk during easing cycles [4]. This aligns with historical patterns where 10-year yields fell during recessions but rose when rate cuts occurred outside of downturns [4].
Timing and Macroeconomic Signals
The Fed's perceived intent—whether proactive (engineering a soft landing) or reactive (mitigating a recession)—shapes market outcomes. For example, the 1998 and 1984 easing cycles, which occurred amid strong economic growth, saw robust equity returns, whereas the 2001 and 2007 cycles faltered due to underlying recessions [3]. Investors should monitor key indicators like core inflation proximity to targets and the pace of previous tightening. A “measured” disinflation process, as seen in the 2023–2025 cycle, often correlates with successful easing [2].
Conclusion
The equity market's response to Fed rate cuts remains a nuanced interplay of pre-market momentum and sector rotation. While short-lived price drifts demand rapid execution, sectoral opportunities are deeply tied to macroeconomic context. In the current cycle, Technology, Consumer Cyclical, and Financials offer compelling prospects, supported by secular trends and easing-driven valuation expansion. However, vigilance is required: historical volatility during rate cuts—exacerbated by divergent economic signals—reminds investors that no strategy is foolproof. By combining core-satellite frameworks with momentum and macroeconomic analysis, investors can navigate the Fed's easing cycle with both agility and discipline.


Comentarios
Aún no hay comentarios