
The Dual Engines of Market Volatility: Behavioral Biases and Structural Mechanics
Market volatility has always been a double-edged sword for investors. While it creates opportunities, it also amplifies risks. But what if the volatility itself isn't symmetrical? Recent research reveals a critical asymmetry: negative market shocks tend to trigger far more pronounced and persistent volatility than positive ones. This phenomenon, rooted in both behavioral psychology and structural market mechanics, demands a deeper understanding for investors navigating today's unpredictable markets.
The Behavioral Psychology of Asymmetric Volatility
Human emotion is the first driver of this asymmetry. Fear and greed, the twin engines of investor behavior, don't operate in balance. The Fear Z Function, a behavioral volatility framework, models how psychological persistence and momentum create asymmetric decay in market stability across different shocks. For instance, during the 2008 Global Financial Crisis and the 2020 pandemic crash, risk aversion and overconfidence-classic behavioral biases-exacerbated market swings. Investors, driven by loss aversion, often overreact to bad news, selling en masse and accelerating declines. Conversely, optimism during gains leads to complacency, allowing volatility to subside more quickly.
Investor attention, measured through digital metrics like the Google Search Volume Index (GSVI), further compounds this asymmetry. In emerging markets with high retail participation, spikes in attention correlate strongly with liquidity shifts and volatility surges. 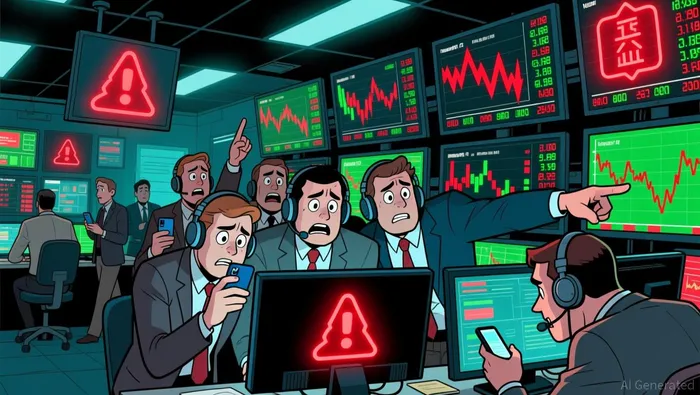 For example, a viral social media post about a stock can trigger a frenzy of buying or selling, distorting price action far beyond fundamental value.
Structural Market Mechanics: Liquidity, Algorithms, and Order Books
While behavioral factors set the stage, structural mechanics amplify the asymmetry. Order Book Imbalance (OBI)-a measure of supply and demand disparity in the limit order book-is a key culprit. In high-frequency trading, OBI predicts short-term price changes, with thinner markets showing greater sensitivity to imbalances. This is particularly evident during earnings announcements, where bad news triggers a flood of sell orders, creating a self-fulfilling downward spiral.
Liquidity dynamics also play a role. Studies on the London Stock Exchange show that interactions between limit and market orders generate endogenous volatility, especially during crises. When liquidity dries up, even small imbalances can trigger large price swings. Meanwhile, advanced algorithms now exploit these imbalances. An asymmetric Hidden Markov Model (HMM), for instance, uses order flow imbalance (OFI) to detect latent market regimes, enabling intraday predictions that outperform traditional strategies.
The Symbiosis of Behavior and Structure
The interplay between behavioral psychology and structural mechanics is where the rubber meets the road. Behavioral biases create asymmetric order flows-more selling during downturns, more buying during euphoria-which then feed into structural imbalances. For example, post-earnings announcement drift (PEAD) is asymmetric: stocks with bad news experience greater price drift due to sustained sell-order imbalances, while those with good news underreact. This isn't just psychology; it's a structural feedback loop.
Moreover, execution algorithms that incorporate OBI metrics have shown resilience in unstable markets. By factoring in order book imbalances, these algorithms avoid price distortions and spoofing, maintaining performance even in manipulated environments. This underscores a critical takeaway: structural tools can mitigate behavioral-driven volatility, but only if designed with both human and mechanical factors in mind.
Implications for Investors
For investors, the lesson is clear: asymmetric volatility isn't a random quirk-it's a predictable pattern shaped by human behavior and market structure. Strategies must account for both. For instance, using GSVI to gauge retail-driven attention in emerging markets could help anticipate liquidity shifts. Similarly, leveraging OBI metrics in execution algorithms can reduce slippage during volatile periods.
However, behavioral biases remain a wild card. During the next crisis, fear will likely dominate, leading to exaggerated sell-offs. Investors who recognize this asymmetry and prepare with tools like the Fear Z Function or HMM models will be better positioned to navigate the chaos.
Conclusion
Market volatility asymmetry is a product of two forces: the irrationality of human psychology and the rigidity of structural mechanics. While behavioral biases like fear and overconfidence set the stage, order book imbalances and liquidity dynamics turn small shocks into market-wide tremors. For investors, the path forward lies in understanding both engines-and building strategies that anticipate their combined impact.


Comentarios
Aún no hay comentarios