
Domino's Pizza Q3 2025 Earnings: Operational Efficiency and Unit Economics Under the Microscope
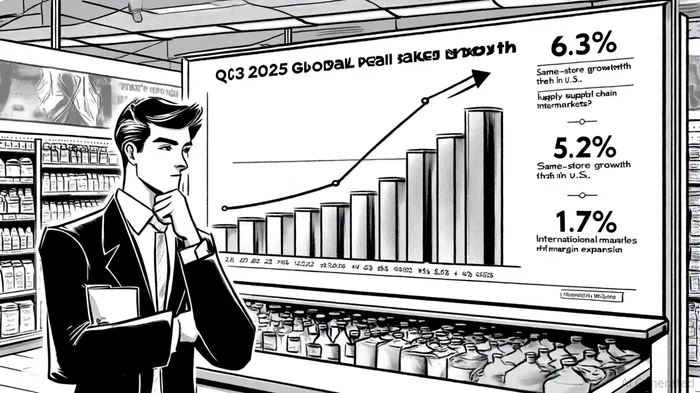
Domino's Pizza's Q3 2025 earnings report underscores a nuanced story of operational resilience and unit economics challenges, offering critical insights for investors. While the company delivered robust global retail sales growth of 6.3% (excluding foreign currency impact) and expanded its store count by 214 units, margin pressures and non-operational losses highlight risks to profitability[1]. Below, we dissect the interplay between operational efficiency, unit economics, and financial performance.
Operational Efficiency: Supply Chain Strength vs. Labor-Driven Margin Compression
Domino's supply chain segment emerged as a bright spot, with gross margin expanding 0.7 percentage points to 11.3% despite a 3.3% rise in food basket pricing[4]. This resilience reflects disciplined procurement strategies, a hallmark of the company's cost-efficiency playbook. However, U.S. company-owned stores faced headwinds, as gross margin contracted 0.5 percentage points to 16.3%, driven by inflationary pressures on wages and internal food pricing[2].
The divergence between supply chain and store-level performance illustrates Domino'sDPZ-- hybrid business model: while franchisees bear the brunt of labor and ingredient costs, the company retains leverage over supply chain margins. This dynamic positions Domino's to buffer some cost shocks but exposes its corporate-owned units to near-term volatility[5].
Unit Economics: Store Growth Outpaces Per-Unit Metrics
Domino's added 29 U.S. stores and 185 international units in Q3, accelerating its global footprint to 21,750 locations[6]. Yet, the absence of disclosed average store revenue or operating income per unit leaves gaps in assessing unit economics. What is clear is that U.S. same-store sales growth of 5.2%-fueled by the "Best Deal Ever" promotion and product innovations like Parmesan Stuffed Crust-offset some margin pressures[3]. Carryout and delivery sales surged 8.7% and 2.5%, respectively, underscoring the franchise's digital and delivery ecosystem strength[5].
Internationally, same-store sales grew 1.7%, a slowdown from prior periods, though expansion in high-growth markets like India and China partially mitigated this[7]. With international stores now accounting for 67% of the global total, Domino's long-term unit economics hinge on replicating U.S. success in diverse regulatory and competitive environments[8].
Financial Highlights: Cash Flow Surge vs. Net Income Decline
Despite a 12.2% increase in income from operations, net income fell 5.2% to $139.3 million due to a $29.2 million non-cash loss on its DPC Dash Ltd. investment and a higher effective tax rate[9]. This disconnect between operating and net income underscores the importance of scrutinizing non-core expenses for investors.
Free cash flow, however, soared 31.8% to $495.6 million, enabling $274.7 million in share repurchases[1]. This capital return strategy, coupled with restrained capital expenditures, signals management's confidence in sustaining growth while rewarding shareholders-a critical factor for long-term value creation[10].
Investment Implications
Domino's Q3 results reflect a company adept at scaling its franchise model and optimizing supply chain efficiency, yet vulnerable to macroeconomic headwinds in labor and commodity markets. For investors, the key questions revolve around:
1. Sustainability of same-store sales growth amid maturing promotions.
- Ability to offset U.S. margin pressures through pricing or productivity gains.
- Execution risks in international expansion, particularly in markets with lower unit economics.
While the stock's valuation remains anchored to its predictable cash flow generation, the absence of granular unit economics metrics (e.g., average store EBITDA) limits precision in modeling long-term returns. Investors should monitor Q4 guidance for clues on how management plans to address these challenges.

Comentarios
Aún no hay comentarios