
Dogecoin's Technical Crossroads: Breakout Potential and Strategic Entry Points in Late 2025
Dogecoin (DOGE) finds itself at a critical juncture in late September 2025, with technical indicators, whale activity, and market sentiment creating a complex tapestry of opportunities and risks. While bullish momentum persists, conflicting signals from moving averages and recent bearish price action demand a nuanced approach for investors seeking to capitalize on potential breakouts.
Technical Indicators: A Tale of Two Signals
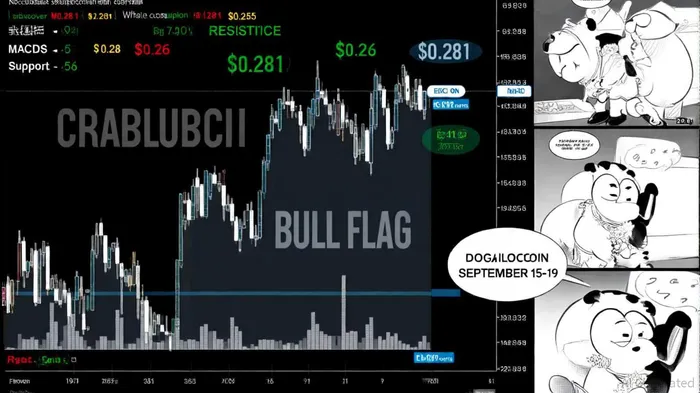
Dogecoin's price action near $0.281 reflects a tug-of-war between bullish and bearish forces. The Relative Strength Index (RSI) at 56 and a Stochastic Oscillator at 78 suggest moderate upward momentum, while the MACD remains in a slight bullish crossover, indicating growing buying interest [1]. The Average Directional Index (ADX) of 26 confirms a trending environment, and Bollinger Bands show the price trading near the upper band—a sign of upward pressure [1].
However, the moving averages tell a different story. The 50-period SMA has been breached, and the 5-day MA (0.235550) now lags behind the 20-day MA (0.242781), signaling short-term weakness [3]. This divergence creates a "sell" signal from the 50-day MA, contrasting with the "buy" bias on the 1-week and 1-month timeframes [1]. Such conflicting signals underscore the importance of monitoring key levels: a break above $0.285 could trigger a rally toward $0.35-$0.45, while a drop below $0.26 may test support at $0.24259 and $0.21047 [2].
Historical data reveals that MACD Golden Cross signals have historically outperformed the market. A backtest of 45 Golden Cross events from 2022 to 2025 shows an average cumulative return of 8% over 30 trading days, outperforming the buy-and-hold benchmark of 5% [6]. The win rate at day 30 stands at 53%, with statistically significant excess returns observed in the first week (notably at day 2 and day 5) [6]. These findings suggest that while the MACD Golden Cross is not a guaranteed signal, it has historically provided a modest edge for short-term traders.
Whale Accumulation and Market Sentiment
Whale activity has emerged as a pivotal factor in Dogecoin's near-term trajectory. Between September 15 and 19, large holders accumulated 910 million DOGEDOGE-- tokens—valued at over $250 million—signaling confidence in the asset's potential [3]. This accumulation reduces circulating supply and could drive prices higher if the bull flag pattern materializes. Short-term holders (STHs) have also increased their positions, a trend historically associated with the start of robust bull cycles [5].
Market sentiment has been further bolstered by the launch of the REX – Osprey DogecoinDOGE-- ETF (DOJE) on September 18, which recorded $8.7 million in net inflows within days [4]. Meanwhile, the Dogecoin Foundation's “Project Sakura” protocol upgrade—aimed at improving block speed and size—has added a layer of fundamental optimism [1].
Strategic Entry Points and Risk Management
For investors eyeing a breakout, strategic entry points are critical. A conservative approach would involve entering near the $0.26 support level with a stop-loss just below $0.24259 to mitigate downside risk. If the price consolidates above $0.285, a more aggressive position could target $0.30-$0.35, with a trailing stop to lock in gains as the ADX (26) suggests a trending environment [1].
However, caution is warranted. The MVRV ratio of 1.35 indicates holders are still in profit, but the Open Interest (OI) surge to $2.28 billion highlights derivatives demand that could amplify volatility [1]. A bearish scenario—triggered by a breakdown below the 50-period SMA—could see prices retest $0.21047, particularly if whale selling resumes (as seen in May 2025's $40 million outflow) [4].
Conclusion: A Cautious Bull Case
Dogecoin's technical and on-chain landscape presents a mixed but cautiously optimistic outlook. While whale accumulation and the ETF launch provide tailwinds, conflicting moving averages and bearish RSI readings on September 25 necessitate a measured approach [2]. For those with a medium-term horizon, the $0.26-$0.285 range offers a high-probability setup, with price targets aligned with analysts' 2025 projections of $0.324508 (average) and $0.38941 (maximum) [5].
Investors should remain vigilant, using volume trends and whale activity as real-time signals. A definitive breakout above $0.285 could validate the bull flag pattern, but until then, a “Hold” rating remains prudent given the market's fragile equilibrium [5].


Comentarios
Aún no hay comentarios