
Dogecoin's Short-Term Price Dynamics: Technical Rebound Potential and On-Chain Divergence in Late 2025
Dogecoin's short-term price action in late September 2025 presents a compelling case study in technical ambiguity and on-chain divergence. While the asset remains trapped in a defined range between $0.2250 support and $0.2450 resistance, recent price behavior and on-chain metrics suggest a tug-of-war between cautious bullish momentum and lingering bearish pressure. This analysis unpacks the technical and on-chain signals shaping DOGE's near-term trajectory and evaluates risk-rebalance opportunities for investors.
Technical Indicators: A Cautious Bull Case
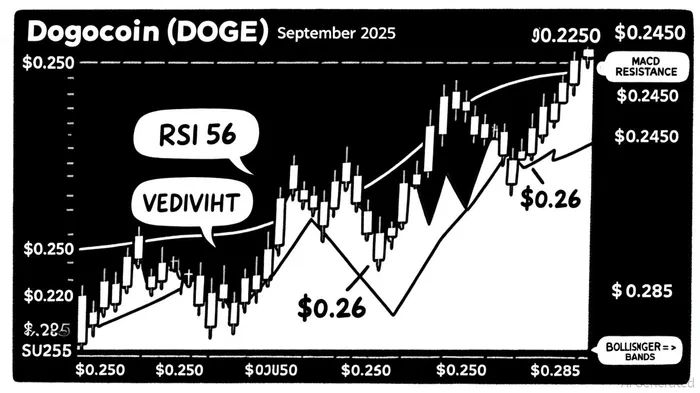
Dogecoin's price has been consolidating within a narrow band, with repeated failed attempts to break above $0.2450 and dips into the $0.2250 support zone[1]. As of September 20, the price hovered near $0.281, with key resistance at $0.285 and support near $0.26[5]. Technical indicators paint a mixed but cautiously optimistic picture:
- Relative Strength Index (RSI): At 56, the RSI suggests moderate bullish momentum without overbought conditions[1].
- MACD: A bullish crossover above the signal line indicates growing buying interest[1].
- Average Directional Index (ADX): At 26, the ADX confirms a trending environment with solid trend strength[1].
- Bollinger Bands: The price trading near the upper band signals upward pressure but also hints at potential exhaustion[1].
However, structural patterns complicate the outlook. An ascending wedge on the daily chart—a bearish formation—suggests a potential breakdown toward $0.197–$0.218 if support levels fail[2]. Conversely, a Wyckoff Accumulation pattern around $0.24 implies strong buying interest, with a short-term target of $0.25 and a longer-term target of $0.30–$0.32 if resistance at $0.243–$0.246 is confirmed[4].
On-Chain Sentiment: Mixed Signals and Risk Divergence
On-chain data reveals a fractured narrative. Whale activity has been a standout bullish signal, with large holders accumulating 158 million DOGEDOGE-- ($50M) in the past week[2]. This accumulation, historically correlated with price surges, suggests institutional confidence despite minor corrections[3]. However, broader on-chain metrics tell a different story:
- Transaction Volume: Declined by 32% in late September, signaling reduced retail engagement[1].
- Network Value to Transactions (NVT) Signal: Elevated levels indicate a valuation disconnect, raising concerns about overvaluation[3].
- Open Interest (OI): Dropped 8.23% to $4.79 billion, reflecting cautious positioning among traders[4].
The drop in daily active addresses—from 500,000 in June to 55,000 in September—further underscores waning utility adoption[2]. Yet, institutional interest and anticipation of ETF approvals remain tailwinds[1].
Risk-Rebalance Opportunities: A Framework for Action
For investors, the key lies in balancing technical and on-chain signals. If DogecoinDOGE-- holds above $0.22 (a critical support level aligning with the 0.618 Fibonacci retracement and the base of an ascending triangle[6]), a rebound toward $0.29 is plausible. A cup and handle pattern on the weekly chart even hints at a 267% rally to $0.880[4], though this would require a dramatic reversal in on-chain fundamentals.
Conversely, a breakdown below $0.22 could trigger a cascade to $0.20 or $0.19[6], exacerbated by declining transaction volume and elevated NVT ratios. Traders might consider hedging long positions with short-term put options or scaling into bullish exposure only after a confirmed breakout above $0.285.
Conclusion: A Tenuous Equilibrium
Dogecoin's short-term dynamics reflect a fragile equilibrium between bullish technical setups and bearish on-chain fundamentals. While whale accumulation and consolidation near key resistance levels offer hope for a rebound, the asset's elevated NVT ratio and declining adoption metrics cannot be ignored. Investors should monitor the $0.22–$0.285 range closely, using volume and open interest as real-time gauges of conviction. In this environment, patience and risk management are paramount.


Comentarios
Aún no hay comentarios