
DOGE Tests $0.11–$0.12 Support as Analyst Flags Key Risk/Reward Zone
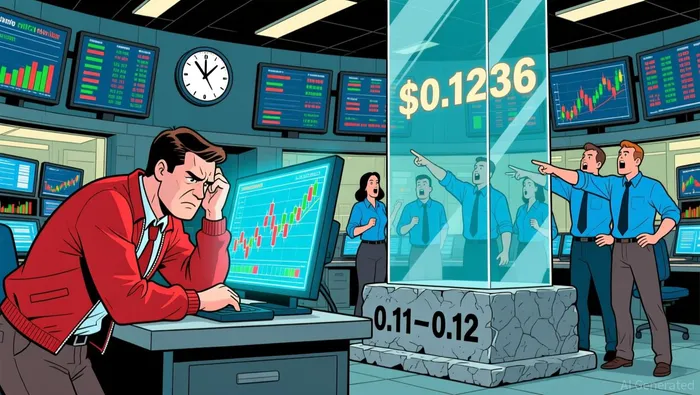
- Dogecoin trades near $0.1236 above a multi-year support zone between $0.11–$0.12. According to analysis
- Analyst Matt Hughes calls this area an "incredible" risk/reward setup with clear technical boundaries. According to analysis
- A break below support could trigger a slide toward $0.05–$0.07 while holding opens path to $0.23. According to analysis
- Broader crypto rotations may influence DOGEDOGE-- as market positioning remains defensive. According to analysis
Dogecoin (DOGE) faces a pivotal technical test near $0.1236 as traders assess a key support zone between $0.11–$0.12. This price range represents a critical risk/reward junction according to prominent market analysts. The outcome could dictate near-term momentum for the memeMEME-- cryptocurrency. Market participants are closely monitoring whether this historical floor holds amid broader crypto rotations. According to market analysis
Why Is Dogecoin's $0.11–$0.12 Range Critical for Traders?
Crypto analyst Matt Hughes identifies the $0.11–$0.12 band as a multi-year "line in the sand" for DOGE. His weekly chart analysis shows this area served as a durable base during the 2022–2023 bear market. The zone now converges with a long-term ascending trendline from Dogecoin's early history. This technical confluence offers traders a clearly defined invalidation point for positioning. According to technical analysis, that structure creates unusually tight risk parameters near current prices.
What Are the Upside and Downside Targets for DOGE?
Hughes' framework outlines several clear technical levels depending on price action. Immediate resistance sits near $0.23, aligning with prior rebound consolidation zones. Further hurdles emerge at $0.35 and $0.46, with major resistance near $0.58–$0.60. Conversely, losing the $0.11–$0.12 support could trigger a slide toward lower trendlines in the $0.05–$0.07 range. According to technical analysis, this setup provides defined risk parameters both above and below current trading.
How Does Broader Market Sentiment Affect Dogecoin?
Altcoin rotations often begin when market conviction appears thin and positioning turns defensive. Some analysts note current conditions align with this historical pattern. That said, the debate continues about whether DOGE's chart structure merits accumulation at current levels. According to market analysis, trading activity shows increased attention to technical boundaries as market participants navigate uncertainty. The resolution of this key support test may signal broader meme coin momentum shifts.


Comentarios
Aún no hay comentarios